Understanding Controllers
Controller Objects in the VPSA represent the clustered virtual controller pair of a VPSA.
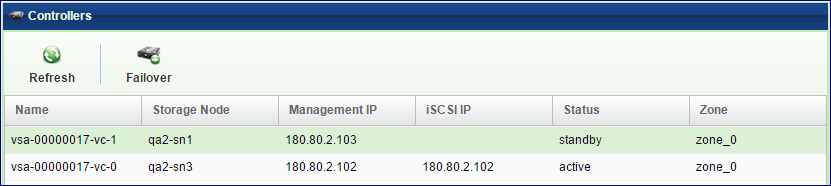
Failover
Failover halts the active controller and activates the standby controller with minimal I/O interruption.
Viewing Controller Properties
Properties
Each Controller displays the following Properties:
Property |
Description |
|---|---|
ID |
Controller name (which is automatically assigned) |
Target |
The iSCSI qualified name (IQN) |
WWPN1 |
Worldwide name of the FC virtual HBA |
WWPN2 |
Worldwide name of the FC virtual HBA |
IPSec Key |
IPsec Key for secured iSCSI connectivity over IPSec |
Encryption Set |
|
VPSA CHAP User |
iSCSI CHAP authentication user name. For use when setting global CHAP on servers |
VPSA CHAP Secret |
iSCSI CHAP authentication password. For use when setting global CHAP on servers |
Cache Size |
Size of Flash Cache of this VPSA |
Heartbeat1 |
Heartbeat status between 2 virtual controllers |
Heartbeat2 |
Heartbeat status between 2 virtual controllers |
Software Version |
Virtual Controller SW build version |
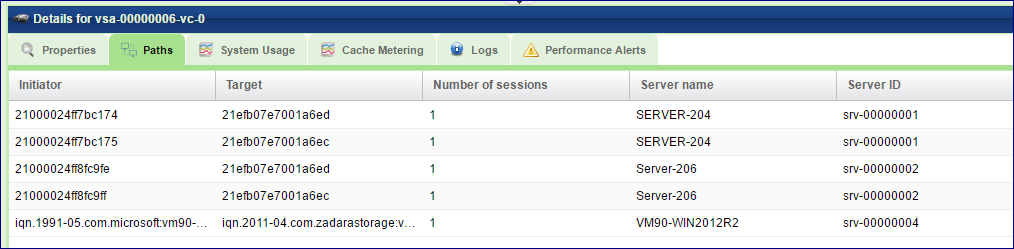
Paths
This tab lists all the paths between this virtual controller and the attached servers. If multipathing is set each server will show all paths, along with the number of active sessions.
For iSCSI connections the initiator and target IQNs are listed.
For Fibre Channel connections the initiator and target WWPN are listed.
Warning
Fibre Channel - VPSA implements the implicit ALUA format. In case all ports of the underlying Storage Node’s HBA (of the active VC) will be disconnected, the VPSA will not initiate a failover.
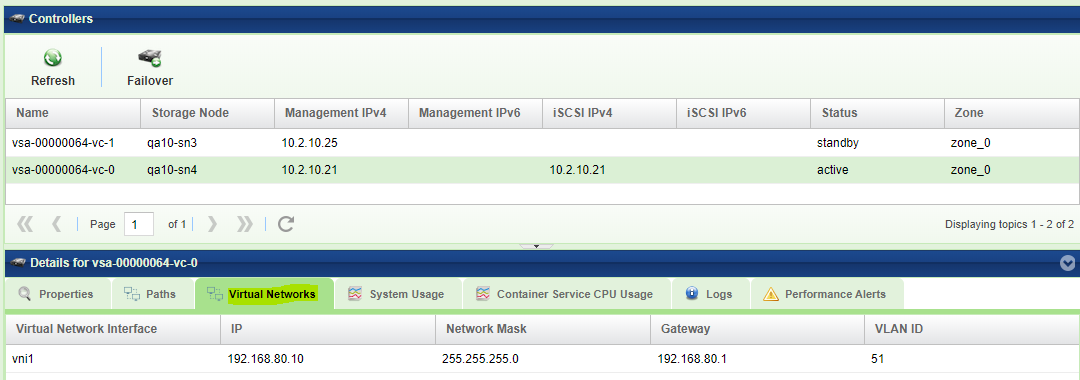
Virtual Networks
If the VPSA was assigned muliple Virtual Networks (See: Managing Virtual Networks ) they are list in the Controller’s south panel.
Each network is displayed with its IP address and the associated VLAN ID.
System Usage
The System Usage Charts provide live metering of the consumption of compute resources on the selected Controller.
The charts display the usage data as it was captured in the past 20 “intervals”. An interval length can be set to one of the following: 1 Second, 10 Seconds, 1 Minute, 10 Minutes, or 1 Hour. The Auto button lets you see continuously-updating live metering info (refreshed every 3 seconds).
System Usage includes the following charts, detailed in the table below:
Chart |
Description |
|---|---|
CPU Usage (%) |
Average usage of all CPU cores |
Memory Usage (%) |
Used memory out of available controller memory |
Bandwidth (KB\s) |
Total networking traffic (in KB) of read and write SCSI commands issued to the Controller, per second. |
SSD Cache Usage (%) |
Amount of Flash Cache used |
Note
Bandwidth graph in the system usage tab shows cumulative virtual network metering stats across all virtual networks. Traffic per virtual network can be seen in VPSA performance dashboard.
Cache Metering
The Metering Charts provide live metering of the IO workload associated with Flash Cache of the selected Controller.
The charts display the usage data as it was captured in the past 20 “intervals”. An interval length can be set to one of the following: 1 Second, 10 Seconds, 1 Minute, 10 Minutes, or 1 Hour. The Auto button lets you see continuously-updating live metering info (refreshed every 3 seconds).
Controller metering includes the following charts:
Chart |
Description |
|---|---|
IOPs |
The number of read and write SCSI commands issued to the Flash Cache of the Controller, per second. |
Bandwidth (MB\s) |
Total throughput (in MB) of read and write SCSI commands issued to the Flash Cache of the Controller, per second. |
IO Time (ms) |
Average response time of all read and write SCSI commands issued to the Flash Cache of the Controller, per selected interval. |
Hit Rate (%) |
Read and write cache hit-rate during the selected interval. |
Logs
Displays all event logs associated with the selected Controller.
Performance Alerts
The Alerts tab lists the configurable alerts of the selected Controller:
Average CPU Usage in the last minute is above the given threshold
Average memory consumption in the last minute is above the given threshold