Understanding the VPSA Object Storage Dashboard
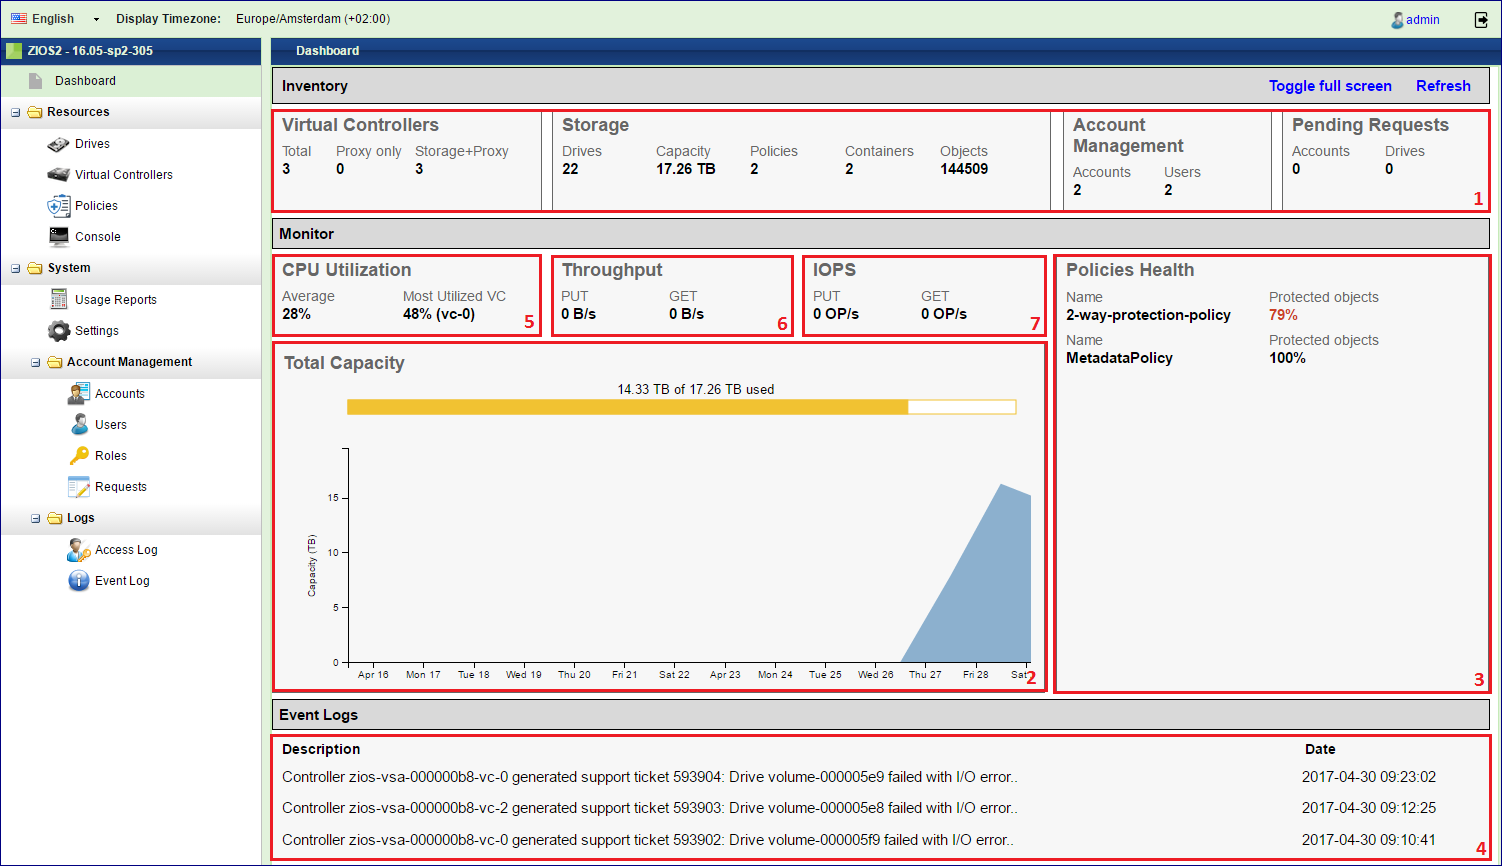
The VPSA Object Storage Dashboard allows administrators to get the overall health of the system at a glance.
Inventory – Lists the number of entities of each type currently defined in the VPSA Object Storage.
Capacity Usage – This chart shows the accumulated used capacity of all storage Policies over time. The bar shows the current used/free capacity.
Policies Health – Lists all storage policies with their health index as calculated by the system.
Events – Shows the top priority latest events that the admin must be aware of.
CPU Usage – Shows the average load on all Virtual Controller and the load on the most utilized Virtual Controller.
Throughput – Shows the current aggregated throughput of all objects Put/Get operations at the proxy level.
IOPS - Shows the current aggregated number of all objects Put/Get operations at the proxy level.