Performance Monitoring
Understanding Performance Monitoring (ZIOS Admin)
This section contains high-level overview to monitoring the storage performance. The VPSA Object Storage Performance Monitor allows you to check and monitor the behavior of each element that can affect the overall storage performance, from the single drive/user/account/controller to the whole VPSA Object Storage system.
Each element of the data path can impact the overall performance if not configured and operates properly. The VPSA Object Storage performance Monitor is a tool for pinpointing a storage performance bottlenecks. The following metrics are of interest to measure the performance of a storage system:
Bandwidth (Throughput): This value is how much read or write throughput a certain Resource (disk, policy etc…) delivers. Usually expressed in Megabytes/Second (MB/s)
OPs: IO operations per second, which means the amount of HTTP operations done in one seconds interval. A certain amount of IO operations will also give a certain throughput of Megabytes each second, so these two are related.
Average Object Size x IOPS = Throughput
Response time (Latency): is the time it takes each IO operation to complete. Latency is measured in milliseconds (ms) and should be as low as possible.
The Performance Monitor
To open the VPSA Performance Monitor, in the left menu navigate to System > Performance section.
The performance monitor view consists of the following elements:
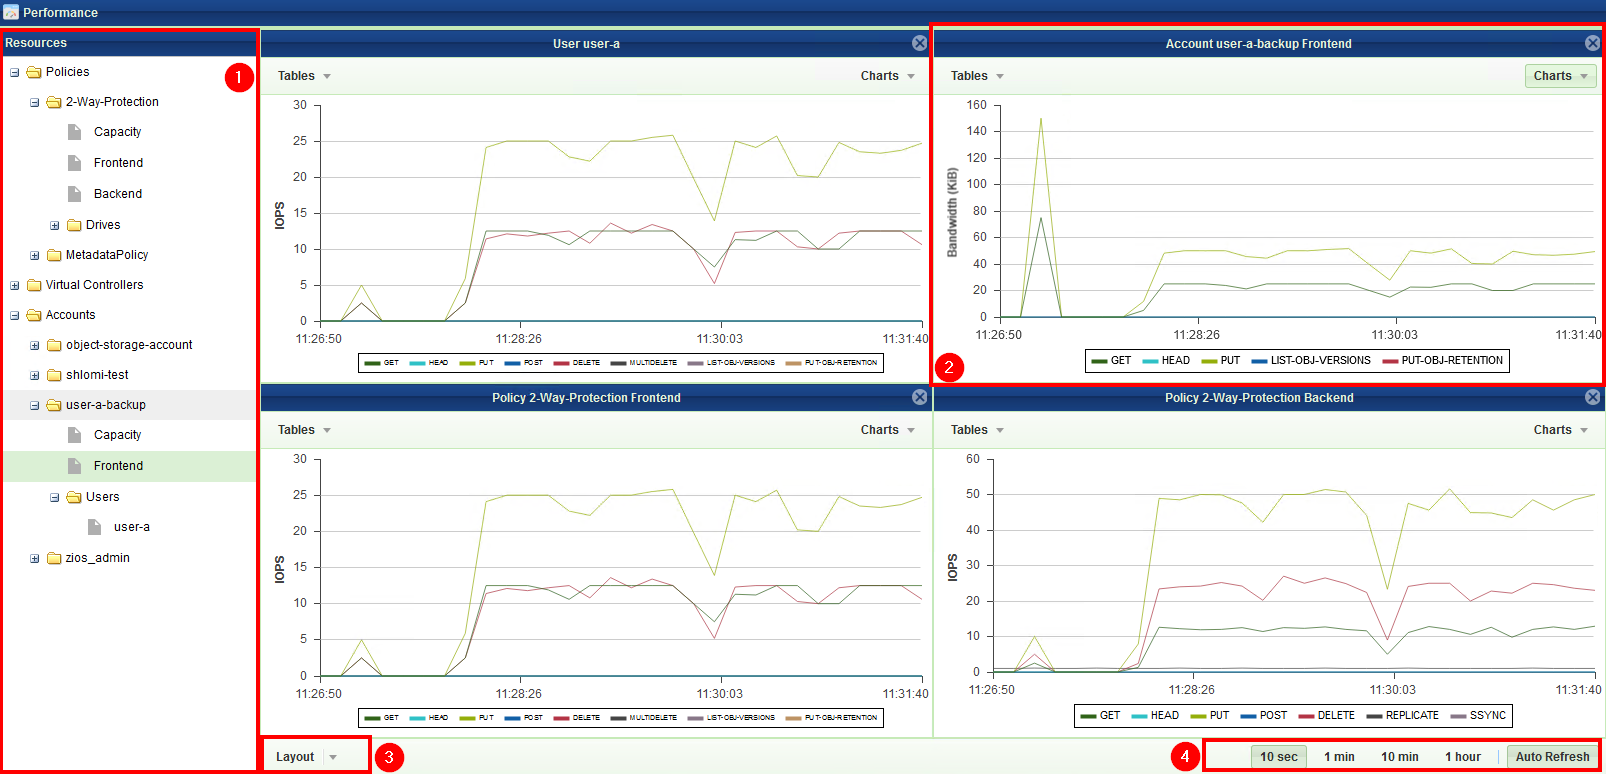
Resources Tree: The Resources Tree lists all the data path objects currently exist in the VPSA Object Storage:
Policies (data policy and metadata policy including their respective drives)
Virtual Controllers (grouped by their type)
Accounts breakdown - Users
Resource Tile: The Performance Monitor has 1 to 9 resource tiles depending on the chosen layout. Each tile contain either a table or a chart.
Layout Selector: Toggles between number of supported layout with different number of tiles.
Interval Selector: Allows switching between different intervals. The interval is a sampling period. Each interval is a single point in the chart. This point represents the average value during that interval.
For examples: If 1 minute interval was selected 60 points are displayed, each one is the average value for that specific minute. In total the last 1 hour is displayed.
The interval selection affects all tiles.
Customizing the Performance Monitor
Customizing the Layout
Go to VPSA GUI > Performance and click the Layout selector
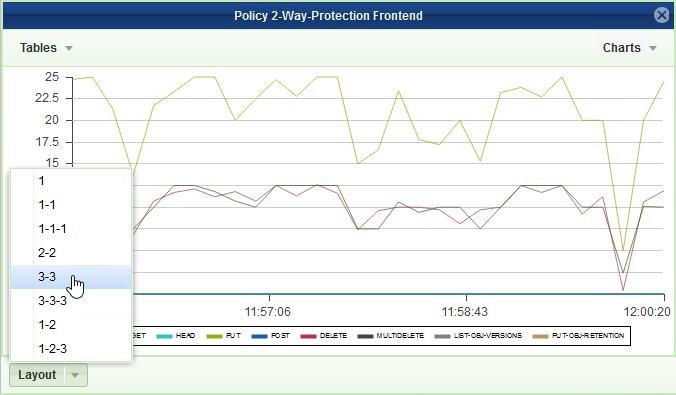
Select the layout of your choice. Note that if the selected layout has fewer tiles than the original the other tiles will be lost, and should be set again.
Drag the object of interest from the resources tree, and drop it into a tile. Do the same for all tiles.
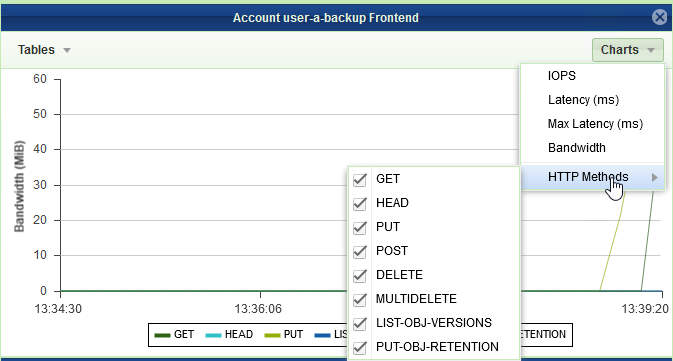
Customizing a Tile
Each tile represent a single resource, and provide number of display options related to the specific resource. The display can be either a table of the most current performance figures, or a chart over time of the recent history.
To display a chart click the Charts button on the top right corner of the tile, and select the metric of interest.
Extended metering
The performance metering engine allows the VPSA Object Storage administrator to turn on extended metering capturing on, this enables much detailed view on the IO stack for each client operation.
For common cases, the extended metering is not needed and will be enabled by Zadara support.
In order to enable/disable extended metering - navigate to System > Settings, under the General settings view, enable the “Detailed Performance Metering” option.
Note
Detailed Performance Metering will be disabled automatically after 30 minutes