Understanding the VPSA Object Storage Dashboard
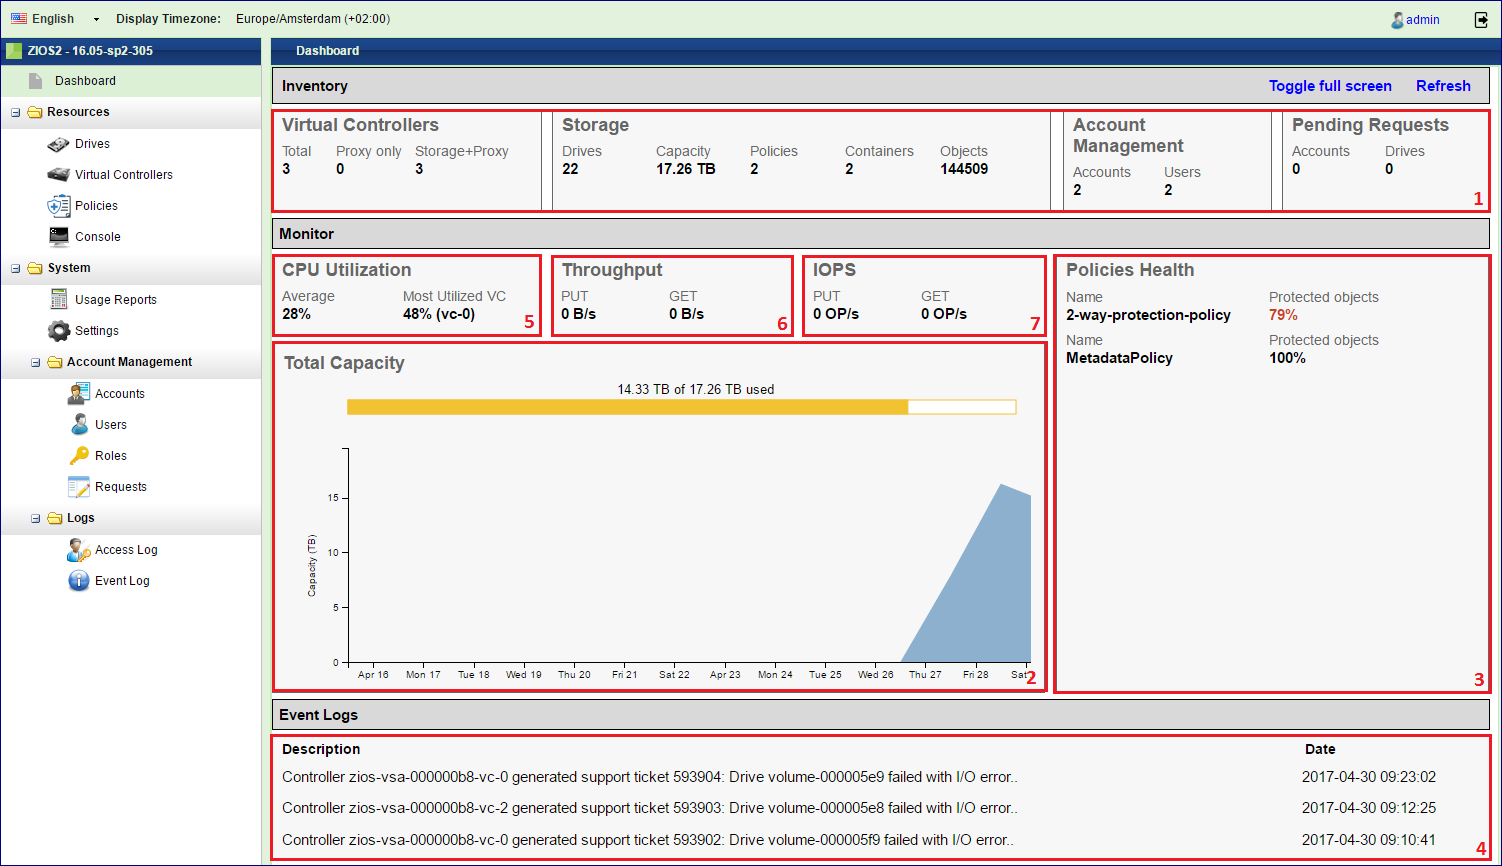
The VPSA Object Storage Dashboard allows administrators to get the overall health of the system at a glance. The dashboard is visible to the Object Storage administrator (zios_admin account) only.
Inventory – Lists the number of entities of each type currently defined in the VPSA Object Storage.
Capacity Usage – This chart shows the accumulated used capacity of all storage Policies over time. The bar shows the current used/free capacity.
Policies Health – Lists all storage policies with their health index as calculated by the system.
Events – Shows the top priority latest events that the admin must be aware of.
CPU Usage – Shows the average load on all Virtual Controller and the load on the most utilized Virtual Controller.
Throughput – Shows the current aggregated throughput of all objects Put/Get operations at the proxy level.
IOPS - Shows the current aggregated number of all objects Put/Get operations at the proxy level.
Note
The VPSA management interface web application is supported in all modern browsers. We recommend using Google Chrome, Firefox or Microsoft Edge for an optimal user experience.