Resources Management
Monitoring Drives
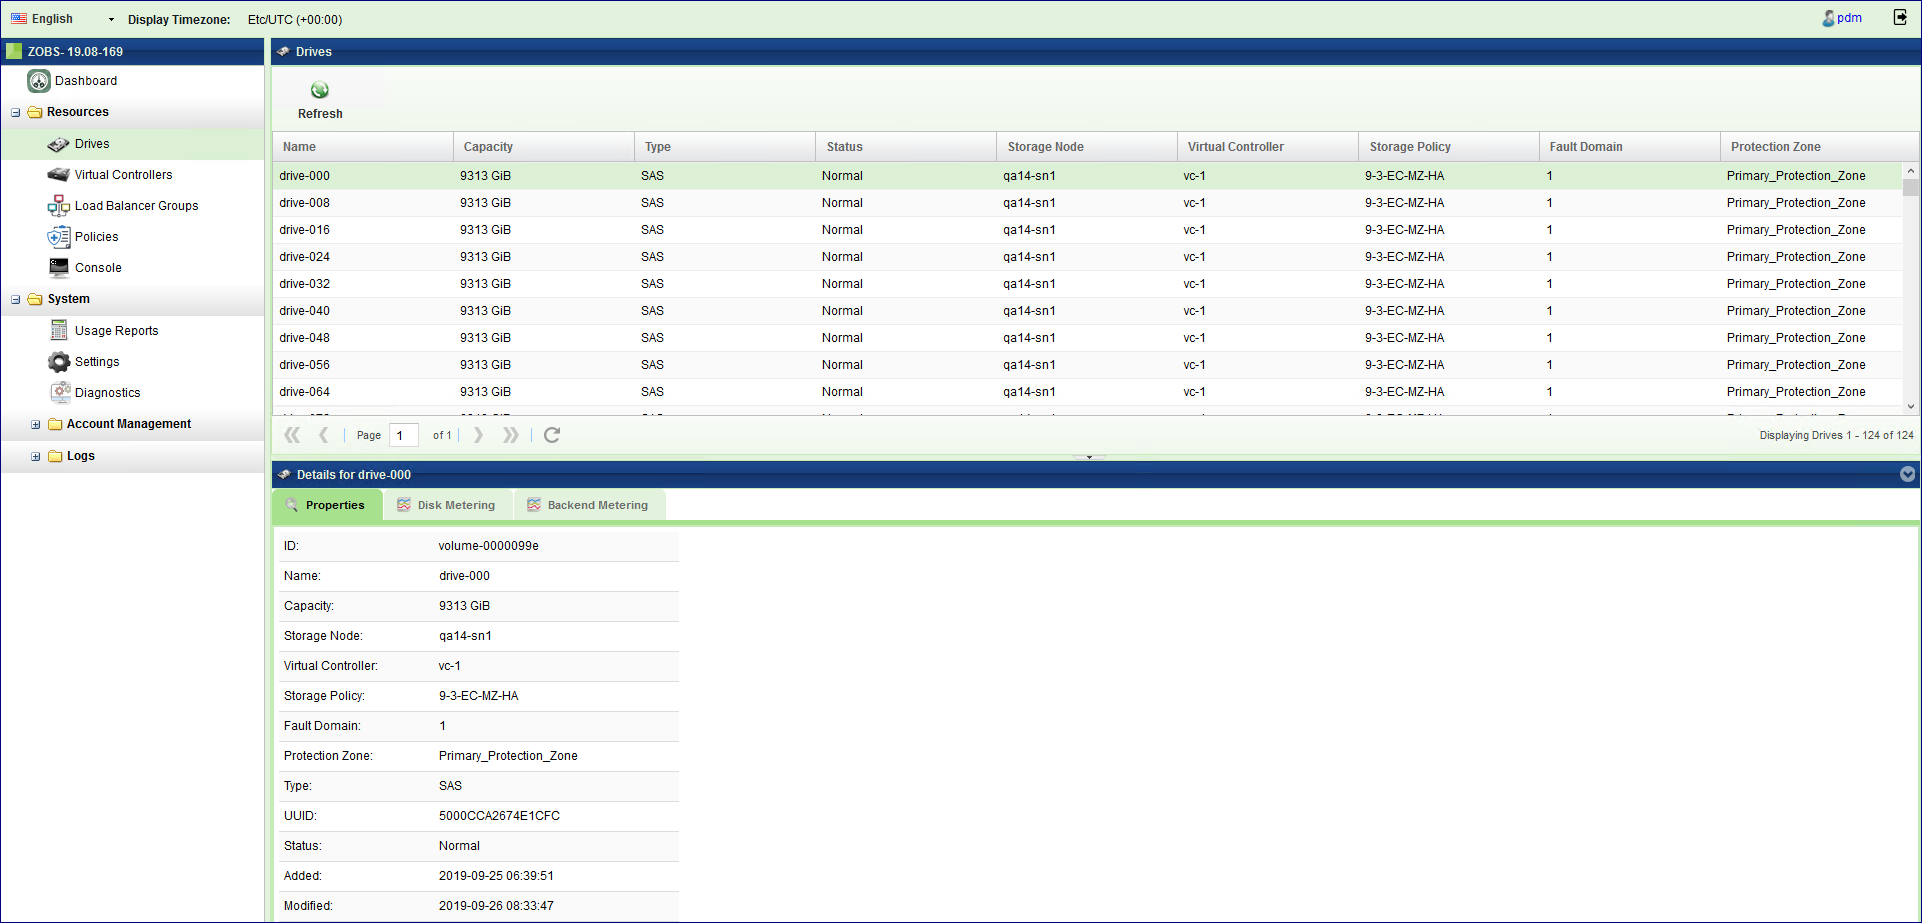
To monitor drives in your Object Storage system open the GUI > Resources > Drives
Viewing Drives Properties (VPSA Object Storage Admin)
The Drives details (properties and metering), are shown in the South Panel tabs:
Properties
Each Drive includes the following properties:
Property |
Description |
|---|---|
ID |
An internally assigned unique ID |
Name |
Automatically assigned name. |
Capacity |
The Drive capacity in GiB |
Storage Node |
The Storage Node that contains the selected Drive |
Virtual Controller |
The virtual controller that owns the selected drives and performs IO operations on it |
Storage Policy |
The Storage Policy where the selected Drive belongs |
Fault Domain |
The Zadara cloud Fault Domain this Drive resides belongs to |
Protection Zone |
The Zadara cloud protection zone this drive is physically located at |
Type |
Drive type: SATA, SAS, SSD |
UUID |
The unique identifier of the drive |
Status |
|
Added |
Date & time when the drive was added |
Modified |
Date & time when the drive was last modified |
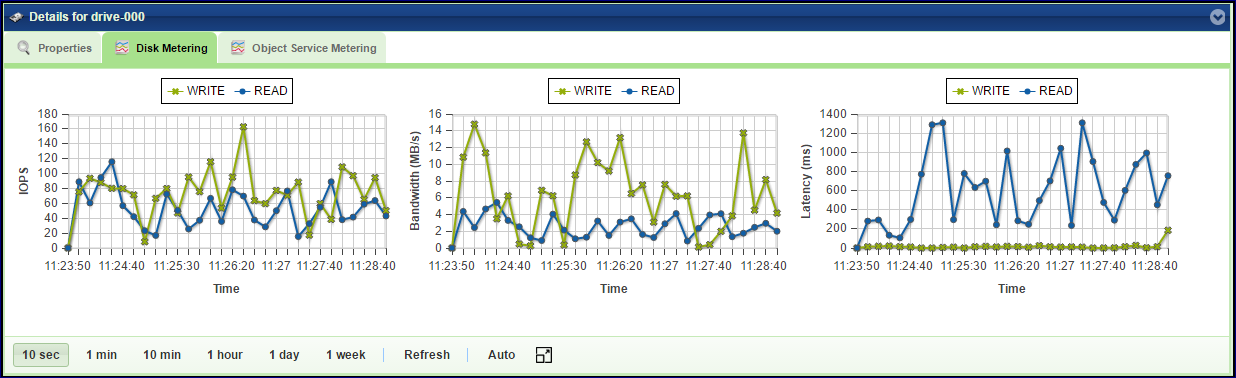
Disk Metering
The Metering Charts provide live metering of the IO workload associated with the selected Drive.
The charts display the metering data as it was captured in the past 20 intervals. An interval length can be one of the following: 10 second, 1 minute, 10 minutes, 1 hour, 1 day, 1 week. The Auto button lets you see continuously-update live metering info.
The following charts are displayed:
Chart |
Description |
|---|---|
IOPs |
The number of read and write commands issued to the selected Drive per second |
Bandwidth (MB/s) |
Total throughput (in MB) of read and write commands issued to the selected Drive per second |
Latency (ms) |
Average response time of all read and write commands issued to the selected Drive per selected interval |
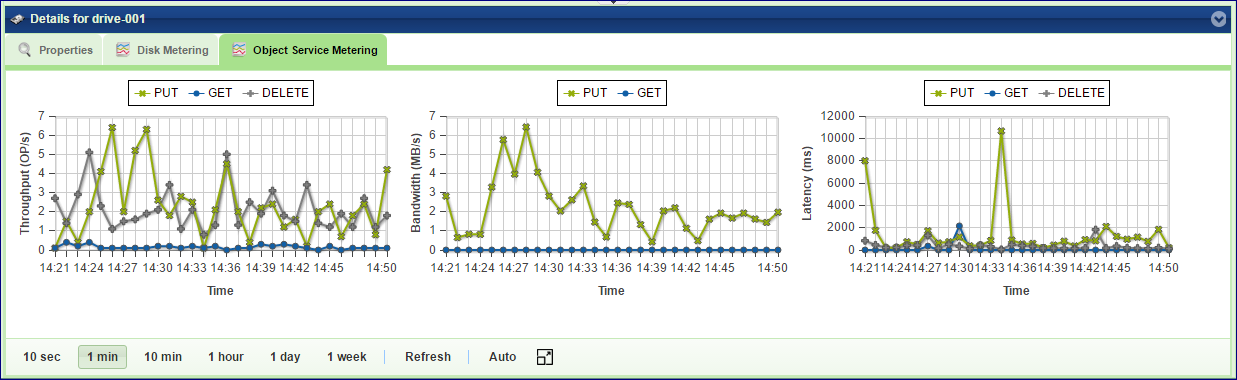
Backend Metering
The Metering Charts provide live metering of the IO workload on the selected Drive.
The charts display the metering data as it was captured in the past 20 intervals. An interval length can be one of the following: 10 second, 1 minute, 10 minutes, or 1 hour, 1 day, 1 week. The Auto button lets you see continuously-updating live metering info.
The following charts are displayed:
Chart |
Description |
|---|---|
Throughput (OP/s) |
The number of operations (PUT/GET/DELETE) that were sent to the selected Drive per second |
Bandwidth (MB/s) |
Total throughput (in MB) of read and write commands that were sent to the selected Drive per second |
Latency (ms) |
Average response time of all operations (PUT/GET/DELETE) that were sent to the selected Drive per selected interval |
Monitoring Virtual Controllers
Virtual Controllers are Virtual Machines (VM) on the Zadara cloud that serves client operations on the Object Storage. For a full list of the VC responsibilities refer to Virtual Controller. Virtual Controllers are automatically created and added/removed to the Object Storage configuration, depending on the number of the allocated drives. There are minimum of two VCs in each VPSA Object Storage deployment: vc-0, vc-1. These VCs have role of Proxy+Storage. To improve performance you can add Proxy only VCs from the Zadara Provisioning Portal as described at Adding Proxy Virtual Controllers (VPSA Object Storage Admin).
Viewing VCs Properties (VPSA Object Storage Admin)
Properties
Each Virtual Controller has the following properties:
Property |
Description |
|---|---|
ID |
An internally assigned unique ID |
Storage Role |
Proxy+Storage / Proxy-Only |
Management Role |
|
Status |
|
Storage Node |
The Storage Node hosting selected VC |
Fault Domain |
The Zadara cloud Fault Domain this VC resides belongs to |
Protection Zone |
The Zadara cloud protection zone this VC is allocated to |
Frontend IP |
The IPv4 or IPv6 address allocated to the VC |
Backend IP |
The VC IP address on the backend network that connects to the Drives |
Load Balancer Group |
(Optional) In case an ELB is enabled, represent the LB Group of the VC |
Added |
Date & time when the VC was added |
Modified |
Date & time when the VC was last modified |
Drives
List the drives assigned to the selected Storage Policy.
Virtual Networks
A set of available IP addresses within a specific network segment. Virtual networks are allocated for a specific cloud tenant and within a specific avilable cloud VLAN.
The following properties are displayed for each virtual network:
Property |
Description |
|---|---|
Virtual Network Interface (VNI) |
The virtual adapter that connects a device to the virtual network. This interface enables network communication within the virtual environment. |
IP |
The IP address assigned to the VNI. |
Network Mask |
The IP definition that defines the number of available host addresses. |
Gateway |
The IP address of the network node that routes traffic from the virtual network to external networks. |
VLAN ID |
The VLAN to which the VNI belongs. |
System Usage
This chart shows the CPU utilization of the selected VC.
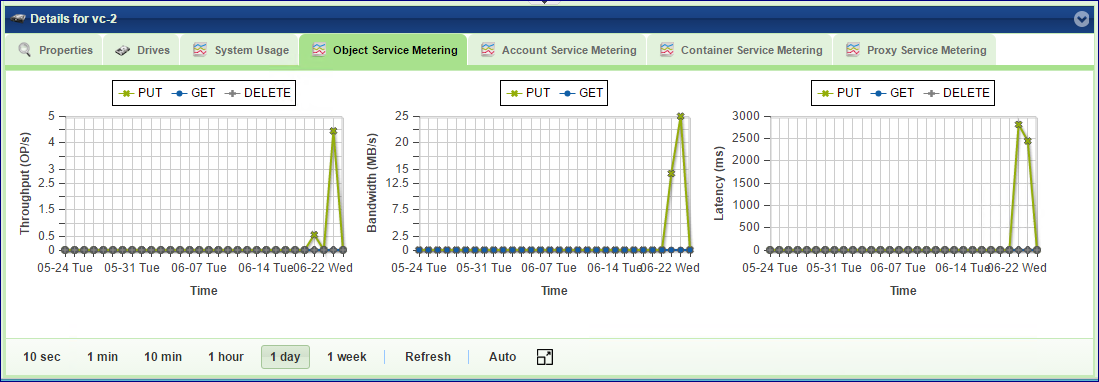
Backend Metering
The Metering Charts provide live metering of the IO workload at the backend of the selected VC.
The charts display the metering data as it was captured in the past 20 intervals. An interval length can be one of the following: 10 second, 1 minute, 10 minutes, or 1 hour, 1 day, 1 week. The Auto button lets you see continuously-updating live metering info.
The following charts are displayed:
Chart |
Description |
|---|---|
Throughput (OP/s) |
The number of operations (PUT/GET/DELETE) issued to objects and handled by the selected VC per second |
Bandwidth (MB/s) |
Total throughput (in MB) of read and write commands issued by the selected VC per second |
Latency (ms) |
Average response time of all operations (PUT/GET/DELETE) issued to objects and handled by the selected VC per selected interval |
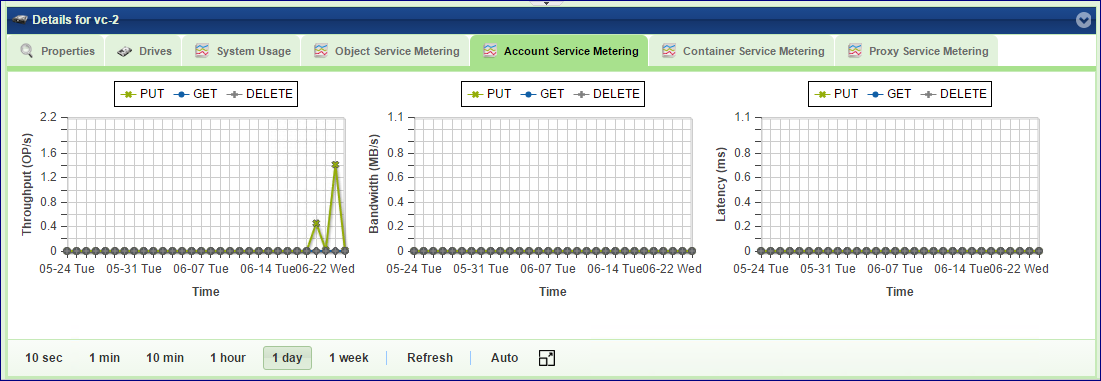
Account Service Metering
The Metering Charts provide live metering of the IO workload on the accounts database at the backend of the selected VC.
The charts display the metering data as it was captured in the past 20 intervals. An interval length can be one of the following: 10 second, 1 minute, 10 minutes, or 1 hour, 1 day, 1 week. The Auto button lets you see continuously-updating live metering info.
The following charts are displayed:
Chart |
Description |
|---|---|
Throughput (OP/s) |
The number of operations (PUT/GET/DELETE) issued to the accounts database and handled by the selected VC per second |
Bandwidth (MB/s) |
Total throughput (in MB) of read and write commands issued by the selected VC to the accounts DB per second |
Latency (ms) |
Average response time of all operations (PUT/GET/DELETE) issued to the accounts database and handled by the selected VC per selected interval |
Container Service Metering
The Metering Charts provide live metering of the IO workload on the containers database at the backend of the selected VC .
The charts display the metering data as it was captured in the past 20 intervals. An interval length can be one of the following: 10 second, 1 minute, 10 minutes, or 1 hour, 1 day, 1 week. The Auto button lets you see continuously-updating live metering info.
The following charts are displayed:
Chart |
Description |
|---|---|
Throughput (OP/s) |
The number of operations (PUT/GET/DELETE) issued to containers and handled by the selected VC per second |
Bandwidth (MB/s) |
Total throughput (in MB) of operations (PUT/GET/DELETE) issued by the selected VC to containers per second |
Latency (ms) |
Average response time of all operations (PUT/GET/DELETE) issued to containers and handled by the selected VC per selected interval |
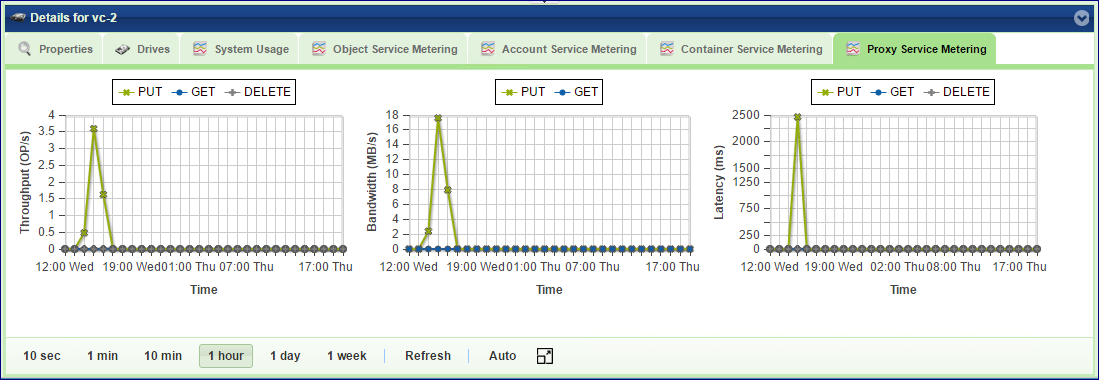
Frontend Metering
The Metering Charts provide live metering of the IO workload at the frontend of the selected VC.
The charts display the metering data as it was captured in the past 20 intervals. An interval length can be one of the following: 10 second, 1 minute, 10 minutes, or 1 hour, 1 day, 1 week. The Auto button lets you see continuously-updating live metering info.
The following charts are displayed:
Chart |
Description |
|---|---|
Throughput (OP/s) |
The number of operations (PUT/GET/DELETE) issued to objects and handled by the proxy of the selected VC per second |
Bandwidth (MB/s) |
Total throughput (in MB) of read and write commands issued to proxy of the selected VC per second |
Latency (ms) |
Average response time of all operations (PUT/GET/DELETE) issued to objects and handled by proxy of the selected VC per selected interval |
Load Balancer Groups (Optional)
Zadara Elastic Load Balancer can be enabled for the VPSA Object Storage in order to provide improved performance and load allocation across the VPSA Object Storage VCs. Once enabled, a dedicated VC will be added to the VPSA Object Storage as the Load Balancer Master. The Load Balancer Master VC will aggregate a bulk of up to 12 VCs from the same protection zone under the same VRID index.
From this view, a VPSA Object Storage administrator can review the utilization and distribution of each Load Balancer Group.
Property |
Description |
|---|---|
ID |
An internally assigned unique ID |
VRID |
The VRRP VRID assigned to the Elastic Load Balancer Group |
VC Master |
The Load Balancer Group Active (Master) VC |
IPv4/IPv6 |
The Load Balancer Group Active (Master) VC IP address |
Protection Zone |
The Zadara cloud protection zone |
Added |
Date & time when the LBG was created |
Modified |
Date & time when the LBG was last modified |
Managing Storage Policies
Storage Policies provide a way for object storage providers to differentiate service levels, features and behaviors of a Object Storage deployment.
Policies can be thought of as a group of drives, with a redundancy level policy assigned to it.
Before placing object data into the VPSA Object Storage, users create a container which holds the listing of all objects stored under the container’s namespace. Users can select the Storage Policy that will be used when storing data objects under a container’s namespace when they create the container. All objects stored in a container will be placed according the configuration of the Storage Policy which was set when the container was created. If no policy was specified at the container creation time, the default policy is used.
To ensure availability of the VPSA object Storage data, the drives assigned to a Storage Policy are evenly distributed between Object Storage Fault Domains. The cloud administrator defines the Fault Domain of each Storage Node. The system makes sure to allocated drives across zones based on the Storage Policy type
Storage Policies allow some level of segmenting in terms of quality of service, within a single system for various purposes. Storage Policies allow objects to be stored based on the following criteria:
Quality of Service: By using different disk drives for different policies, tiers of storage performance can be created. For example, an SSD-only policy can be created used to implement a low-latency/high performance tier.
Number of Replicas: offer different protection levels in the same VPSA Object Storage cluster
2 Way replication offers protection for one FD failure, at the cost of 50% storage utilization.
Erasure Coding (2+1, 6+3) offers protection for 1 FD failures, at the cost of 67% storage utilization.
Erasure Coding (6+2, 9+3) offers protection for 1 FD failures, at the cost of 75% storage utilization.
2 Way replication (Multizone-HA offers protection for one FD failure, on each zone or a complete protection zone failure at the cost of 50% storage utilization per protection zone.
Erasure Coding (4+2, 2+1 - Multizone-HA) offers protection for 1 FD failures, on each zone or a complete protection zone failure at the cost of 67% storage utilization per protection zone.
Erasure Coding (6+2, 9+3 - Multizone-HA) offers protection for 1 FD failures, on each zone or a complete protection zone failure at the cost of 75% storage utilization per protection zone.
The following Storage Policies are supported:
Object Storage Data Protection Policies¶ Policy Type
Redundancy
Minimal Configuration
2 Way
x 2
2 VCs on 2 SNs, each in a different Fault Domain
Erasure Coding 2+1
x 1.5
3 VCs on 3 SNs, each in a different Fault Domain
Erasure Coding 4+2
x 1.5
3 VCs on 3 SNs, each in a different Fault Domain
Erasure Coding 6+2
x 1.33
4 VCs on 4 SNs, each in a different Fault Domain
Erasure Coding 9+3
x 1.33
4 VCs on 4 SNs, each in a different Fault Domain
Erasure Coding 2+1 4+2 (Multizone-HA)
x 1.5
3 VCs on 3 SNs, each in a different Fault Domain (in each region)
Erasure Coding 6+2 9+3 (Multizone-HA)
x 1.33
4 VCs on 4 SNs, each in a different Fault Domain (in each region)
Each drive in the system is assigned to one Storage Policy.
VPSA Object Storage is created with a default data Storage Policy for objects and another system Storage Policy for metadata. The VPSA Object Storage administrator (zios_admin) can later on create additional storage policies, expand existing policies and set a specific policy as the Default Policy.
For Multizone HA VPSA Object Storage, the protection policy is created symmetrically on both zones, in each availability zone, the same protection policy will be created in order to sustain a complete availability zone failure.
Policies are assigned when a container is created. Once a container has been assigned for a policy, it cannot be changed (unless it is deleted/recreated).
Storage Policies (VPSA Object Storage Admin)
When a VPSA Object Storage system is created, 2 policies are created by default:
MetadataPolicy: Used to store the Accounts and Containers metadata, usually contains 2 SSD drives, with 2-way replication
2-way/EC-protection-policy: Used to store the users’ objects, usually contain all the drives that were assigned to the Object Storage at creation time, with 2-way replication or EC protection, according to the initial selection on the provisioning portal.
Policies Properties (VPSA Object Storage Admin)
You can view the following properties and metering information in the Policies Details South Panel tabs:
Properties
Each Policy includes the following properties:
Property |
Description |
|---|---|
ID |
An internally assigned unique ID |
Name |
The name of Policy |
Type |
Object or Account/Container |
State |
Not Configured / Configuring / Initialized |
Description |
A user defined policy description |
GB per Month Price |
Price of used capacity for charge back purposes |
Health Status |
Normal / Degraded / Critical |
Health Percentage |
Indicates the percentage of the stored data that is accessible. |
Rebalance Status |
Normal / Rebalancing / Failed |
Rebalance Prec. |
Indicates the progress of the rebalance process |
Cross-Region Rep-mode |
Synchronous (for VPSA Multizone HA) |
Policy Capacity |
Total usable capacity of the storage policy |
Policy Used Capacity |
Total capacity used in the storage policy |
Data Usage |
Amount of written data in the storage policy by the Object Storage account’s users |
Containers |
Total amount of containers created within the policy |
Objects |
Total amount of objects created within the policy |
Default |
Yes/No |
Redundancy Level |
2-way/EC |
Ring Version |
Ring Database version |
Rebalanced |
The date and time when the Policy was last rebalanced. (Rebalance usually happens when the HW configuration changes, Adding/removing drives, failed components, etc.) |
Added |
The date and time when the Policy was added |
Modified |
The date and time when the Policy was last modified |
Note
Please note that Policy Used Capacity attribute will always reflect higher capacity consumption than Data Usage. The Policy Used Capacity also include the underlying filesystem metadata and reserved storage while the policy is being rebalanced. Data Usage is the actual account’s data usage representation.
Drives
List the drives assigned with the selected Storage Policy.
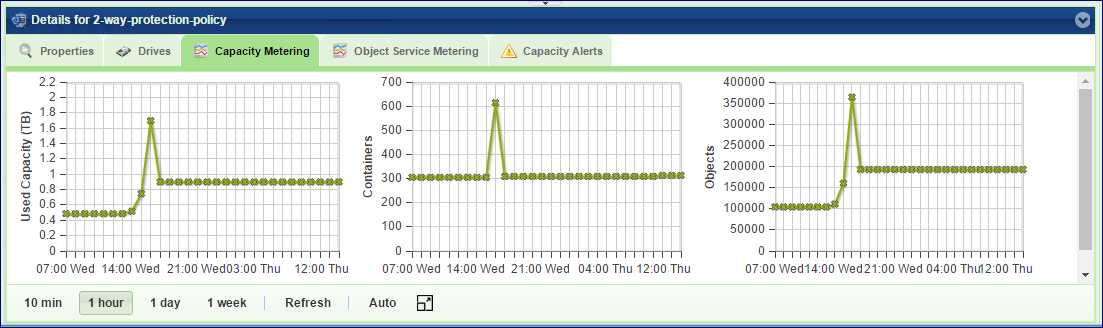
Capacity Metering
The Metering Charts provide live metering of the capacity usage associated with the selected Policy.
The charts display the metering data as it was captured in the past 20 intervals. An interval length can be one of the following: 10 minutes, or 1 hour, 1 day, 1 week. The Auto button lets you see continuously-updating live metering info.
The following charts are displayed:
Chart |
Description |
|---|---|
Used Capacity |
Total storage capacity consumed in the selected Policy |
Containers |
Total numbers of containers that store their objects in the selected policy |
Objects |
Total numbers of objects stored in the selected policy |
Backend Metering
The Metering Charts provide live metering of the IO workload associated with the selected Policy.
The charts display the metering data as it was captured in the past 20 intervals. An interval length can be one of the following: 10 second, 1 minute, 10 minutes, or 1 hour, 1 day, 1 week. The Auto button lets you see continuously-updating live metering info.
The following charts are displayed:
Chart |
Description |
|---|---|
Throughput (OP/s) |
The number of operations (PUT/GET/DELETE) issued to the Drives of the selected Policy per second |
Bandwidth (MB/s) |
Total throughput (in MB) of read and write commands issued to the Drives of selected Policy per second |
Av. Drive Latency |
Average response time of all operations (PUT/GET/DELETE) issued to objects in the selected Policy per selected interval |
Frontend Metering
The Metering Charts provide live metering of the IO workload associated with the traffic coming to the selected Policy.
The charts display the metering data as it was captured in the past 20 intervals. An interval length can be one of the following: 10 second, 1 minute, 10 minutes, or 1 hour, 1 day, 1 week. The Auto button lets you see continuously-updating live metering info.
The following charts are displayed:
Chart |
Description |
|---|---|
Throughput (OP/s) |
The number of operations (PUT/GET/DELETE) issued to objects in the selected Policy per second |
Bandwidth (MB\s) |
Total throughput (in MB) of read and write commands issued to the selected Policy per second |
Avg. Latency (ms) |
Average response time of all operations (PUT/GET/DELETE) issued to objects in the selected Policy per selected interval |
Capacity Alerts
The VPSA Object Storage administrator can set their own custom configuration for capacity monitoring.
Alert Threshold
Send Alert when it is estimated that the Policy will be at full capacity within the given time period (default 43,200 minutes - 30 days).
Alert Interval
The period of the sample collection window to calculate the rate at which the free space is consumed in the storage policy.
Default 1,440 minutes
Minimal value is 10 minutes
Minimum used capacity to trigger the alert is 60%
Emergency Threshold
The threshold to trigger administrator capacity emergency state notifications
Default is 85%
Minimal value is 60%
Alert will be triggered hourly as long as the policy is in “Emergency state”
Adding Drives to Policy (VPSA Object Storage Admin)
Drives are added to an Object Storage policy via the Provisioning Portal. To add drives into a policy, go to the Provisioning Portal, select the VPSA Object Storage of interest and click Add Storage. Follow the instruction here: Adding Drives to an Existing Storage Policy (VPSA Object Storage Admin).
Note
Drive-related operations in a storage policy will require rebalance that might take several hours until completion.
Removing Drives from Policy (VPSA Object Storage Admin)
If the there is a need to reduce the total available capacity of a given policy, or to remove some failed drives that were detached from the policy, you may remove drives from the policy and return them to the cloud for a different use. To remove drives from a Policy go to GUI > Policies, select the policy of interest, and click Remove Drives.
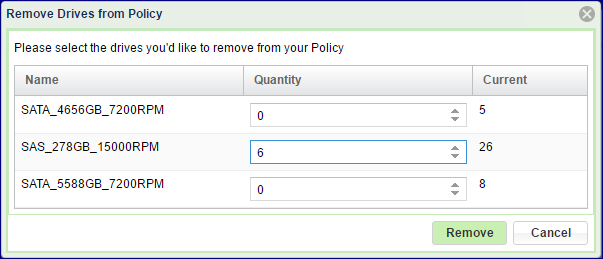
The dialog that will open will list all the drives types and quantities that currently belong to the policy. Set the number of drives you want to remove from each type, and click Remove.
Note
Drive-related operations in a storage policy will require rebalance that might take several hours until completion.