VPSA Object Storage Dashboard
VPSA Object Storage administrators and Object Storage Account administrators have a dedicated dashboard view that provides a “snapshot” of the current status, activities and trends in their scope (global array and account level respectively).
Please refer to the relevant dashboard per your permission:
VPSA Object Storage administrator dashboard
The VPSA Object Storage Dashboard allows administrators to get the current
health, stats and capacity information at a glance. The dashboard is visible
to the Object Storage administrator (zios_admin account) only.
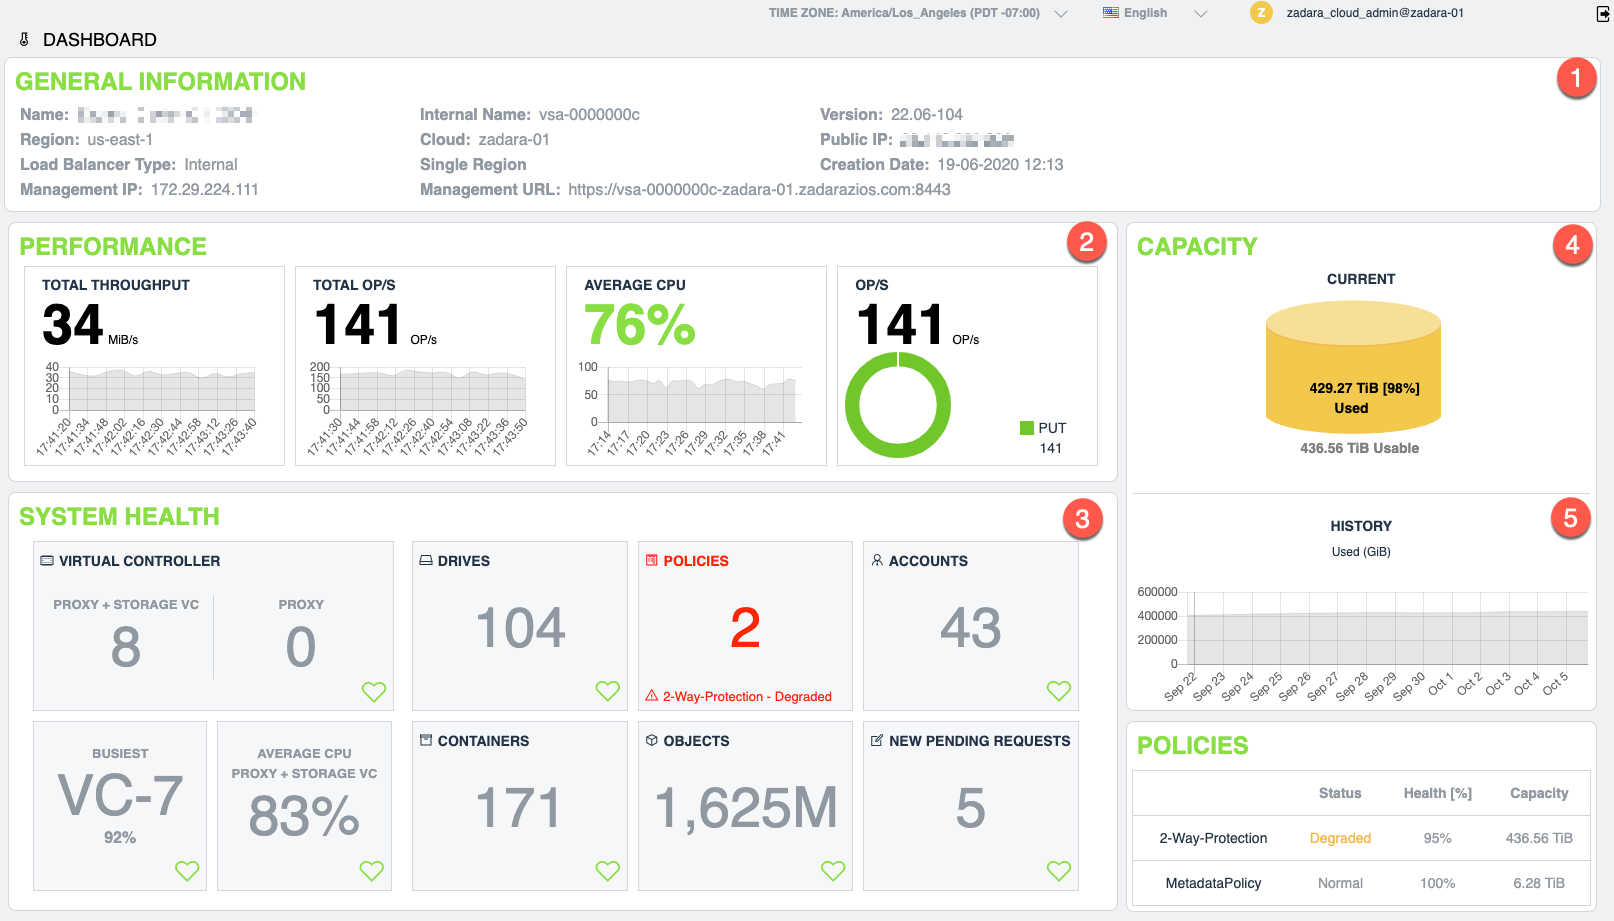
The dashboard has 5 sections:
General information - list general Object Storage information such as:
Name - VPSA Object Storage display name as provided during the creation process
Region - the region attribute defined by the administrator (default:
us-east-1), used primarily for AWSv4 signaturesLoad Balancer Type - Internal (default) or ZELB (Zadara Elastic Load Balancer)
Management IP - the frontend network IP address assigned to the VPSA Object Storage and used as the access endpoint, the DNS name registered automatically will match to this IP address
Internal name - the cloud’s UUID
Cloud name - the Zadara zStorage cloud name
Deployment type -
Single RegionorMulti-ZoneManagement URL - the DNS name for the VPSA Object Storage
Version - the VPSA Object Storage software version
Public IP - the public IP assigned to the VPSA Object Storage (optional)
Creation date - the VPSA Object Storage creation date
Performance - breaks down of the current performance metrics of the array:
Throughput - the total throughput being served currently by the object storage controllers
Total OP/s - object operations per second, aggregated value for all operations served by the object storage controllers
Average CPU%- CPU usage % (average) for the
Proxy+StoragecontrollersOP/s - break down of object operation per type (will list the “common” operations as PUT/GET/DELETE, for more detailed breakdown use the performance section)
System health - object storage system inventory and status:
Virtual Controller - VC headcount for the VPSA Object Storage
Drive - data drive count
Policies - count and status of the system data policies
Objects - object count across all object storage accounts/containers
Warning
The object count for versioned containers (containers with versioning enabled) will present a wrong value (double the actual object count as visible to the object storage client). Accurate object count per container can be viewed in the VPSA Object Storage console view.
Containers - containers (buckets) count across all system accounts
Accounts - active account count
New pending requests - account creation requests that are pending for administrator approval
Capacity – This chart shows the accumulated used capacity fro the data storage policies over time. The bar shows the current used/free capacity along with a historical trend of the used capacity.
Policies – Lists all storage policies with their health index as calculated by the system.
VPSA Object Storage Account administrator dashboard
Similar to the object storage administrator, the VPSA Object Storage dashboard, allow account administrators to get the overall status of the system at a glance. The dashboard is visible to the object storage account administrators.
The dashboard has 5 sections:
General information - list general Object Storage information such as:
Account Name - the VPSA Object Storage account name as provided during the creation process
Version - the VPSA Object Storage software version
Deployment type -
Single RegionorMulti-ZoneManagement URL - the DNS name for the VPSA Object Storage
Region - the region attribute defined by the administrator (default:
us-east-1), used primarily for AWSv4 signaturesLoad Balancer Type - Internal (default) or ZELB (Zadara Elastic Load Balancer)
Public management URL - the public endpoint assigned to the VPSA Object Storage (optional)
Name - VPSA Object Storage display name as provided during the creation process
Region - the region attribute defined by the administrator (default:
us-east-1), used primarily for AWSv4 signaturesManagement URL - the DNS name for the VPSA Object Storage
Management IP - the frontend network IP address assigned to the VPSA Object Storage and used as the access endpoint, the DNS name registered automatically will match to this IP address
Internal name - the cloud’s UUID
Account creation date - the object storage account creation date
Cloud name - the Zadara zStorage cloud name
Performance - breaks down of the current performance metrics of the array:
Throughput - the total throughput being served currently by the object storage controllers
Total OP/s - object operations per second, aggregated value for all operations served by the object storage controllers
OP/s - break down of object operation per type (will list the “common” operations as PUT/GET/DELETE, for more detailed breakdown use the performance section)
Account status - account level snapshot:
Total capacity - total used capacity for the account
Users - account user count
Containers - containers (bucket) count
Quota status - indication whether account quota was enabled by the VPSA Object Storage administrator
Objects - object count across all containers within the account
Warning
The object count for versioned containers (containers with versioning enabled) will present a wrong value (double the actual object count as visible to the object storage client). Accurate object count per container can be viewed in the VPSA Object Storage console view.
Average object size - the average object size within the account
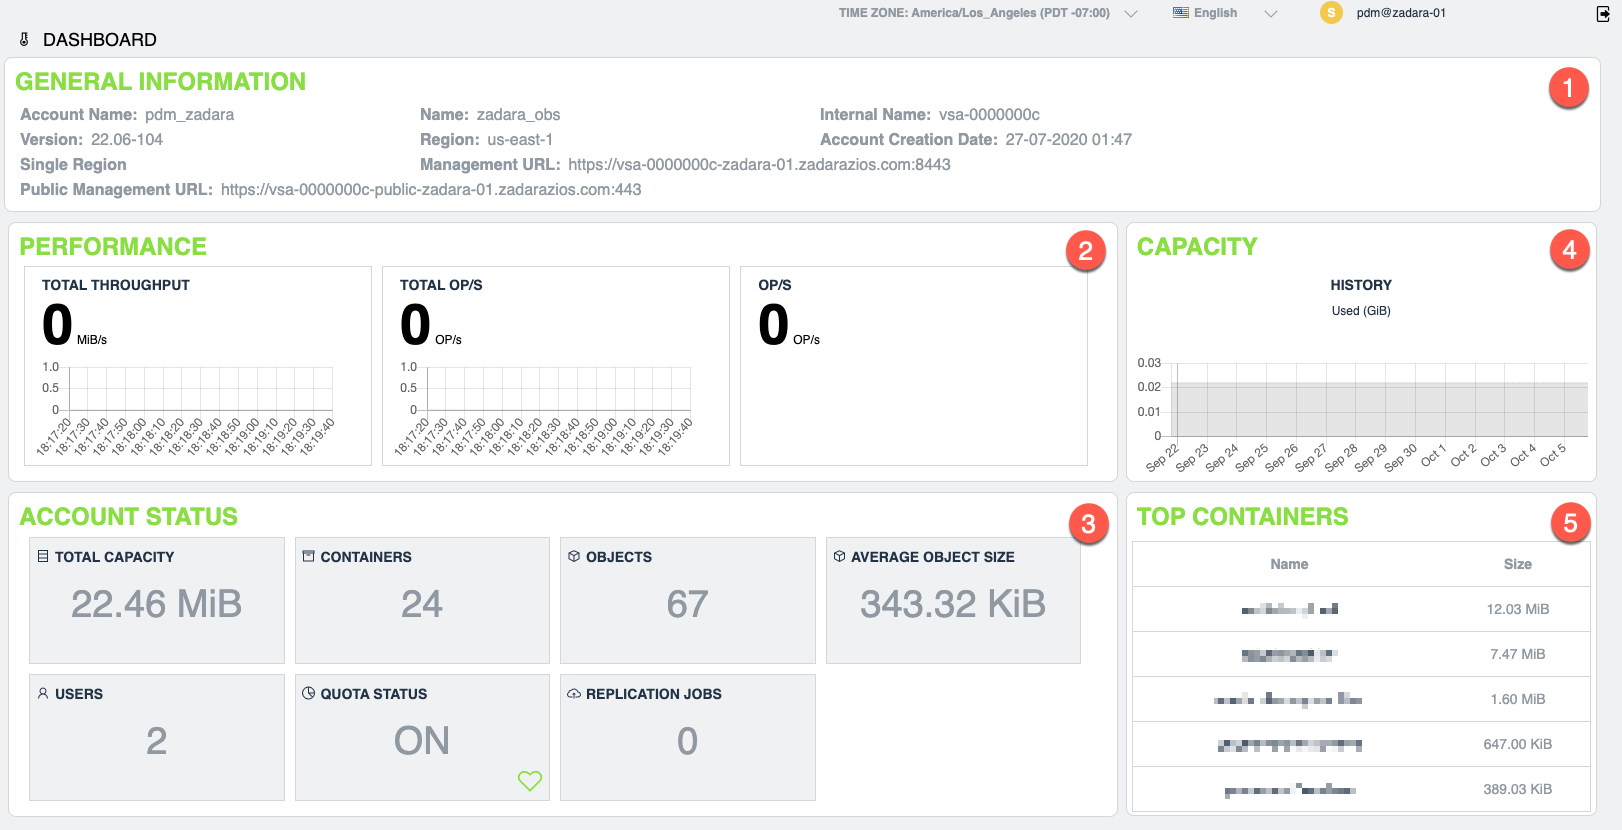
Capacity - capacity usage trend
Top containers - list of the top containers (sorted by capacity)