zCompute Monitoring
Introduction
zCompute provides monitoring tools that help administrators track and manage system and workload activities.
Monitoring Overview dashboard
Each zCompute cluster has a main Monitoring > Overview dashboard, that displays several tiles.
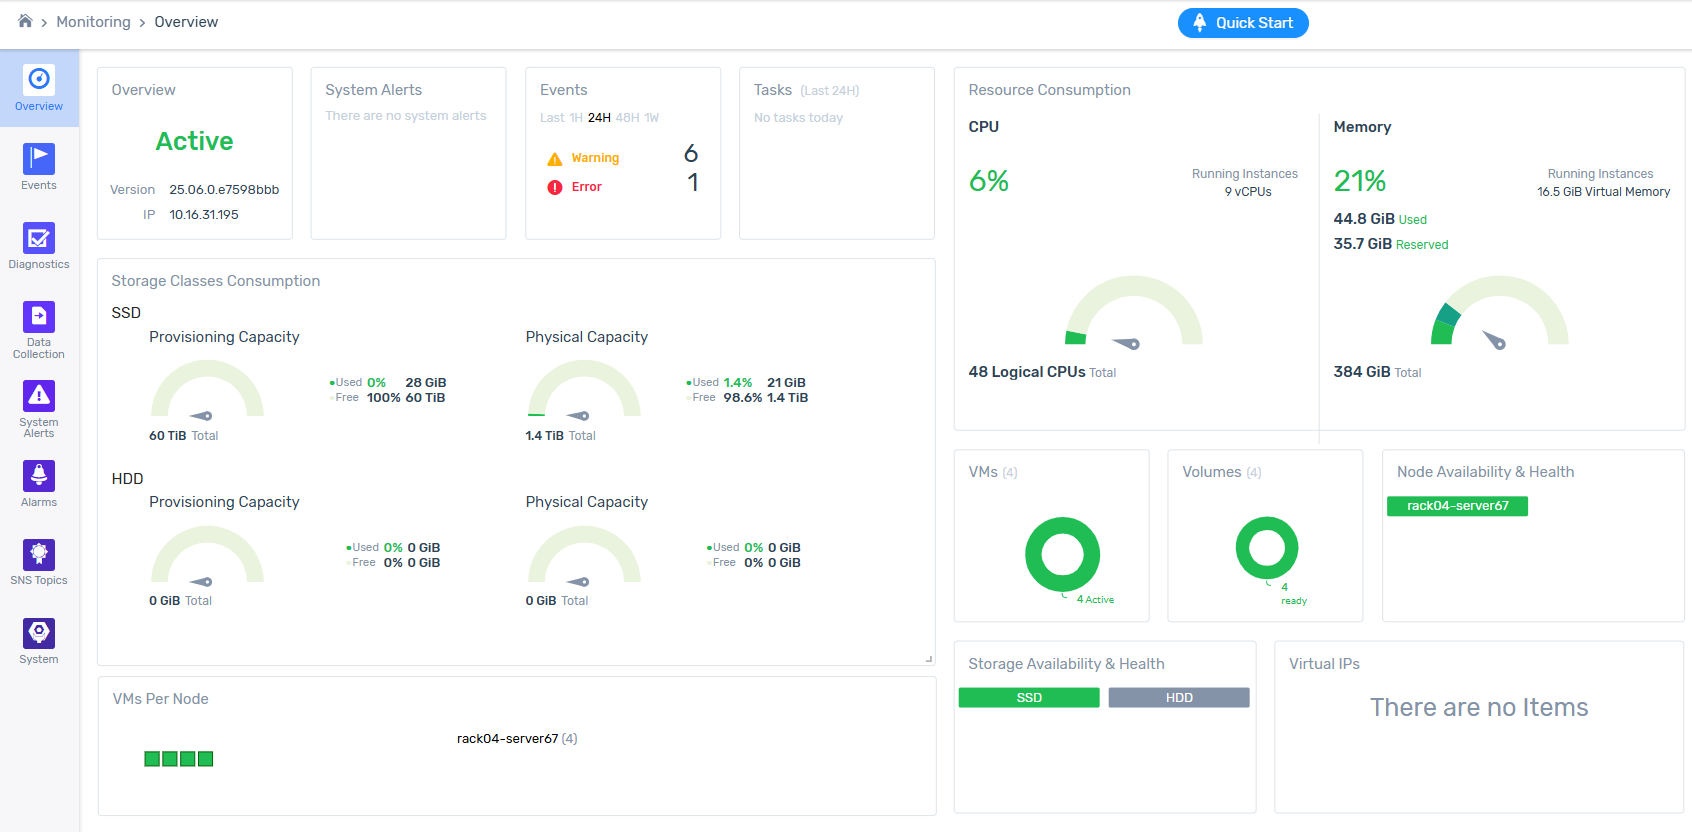
Overview
Displays the cluster’s basic information:
The status of the cluster.
The zCompute software version operating the cluster.
The cluster’s IP address.
System Alerts
Indicates if there are any current system alerts.
In the event of a current alert, hovering the mouse over the reported alert provides a clickable link to navigate directly to the System Alerts screen, for further drilldown to details.
Events
Displays the number of events that occurred in the most recent time period, grouped by severity. The time period in the dashboard’s Events tile can be adjusted to reflect the past:
Hour
24 hours
48 hours
Week
Hovering the mouse over a severity group of events provides a clickable link to navigate directly to the Events screen listing the events, filtered according to the selected severity level and time period.
Tasks
Displays tasks of the past 24 hours.
Resource Consumption
Display system resource consumption for the cluster:
CPU
Shows average CPU usage of this host and the total vCPUs of running VMs that are scheduled on the underlying Logical CPUs (hardware threads).
CPU %: The percentage of current CPU utilization of all logical CPUs on the cluster.
Running Instances: The sum of virtual CPUs (vCPUs) allocated to all VM instances currently active on the cluster.
Logical CPUs: The sum of hardware execution threads that exist on the physical cluster.
Memory
Shows average memory usage of this cluster and how the total virtual RAM of running VMs consumes the underlying physical memory capacity.
Memory %:
Overall memory utilization of the cluster, showing how much of the physical RAM is currently in use or reserved.
Used:
Amount of physical RAM actively consumed by the cluster and currently running VMs.
Reserved:
Physical RAM that has been committed to VMs and system services but might not be fully used yet. It is set aside and unavailable for other allocations.
Running Instances (Virtual Memory):
Sum of RAM configured for all VMs currently running on this cluster (total of their virtual memory sizes).
Total:
The total physical RAM installed on the cluster.
Clicking anywhere in the Memory tile opens a Memory Breakdown popup chart displaying total used and available memory capacity by:
Used by System
Reserved for System
Used by VMs
Rerserved for VMs
Free for VMs
Storage Classes Consumption
Shows the cluster’s disk allocation capacities, in use and free:
SSD
Provisioned Capacity:
The total, used and free amounts of SSD storage space assigned to the cluster, as the host OS sees as its drive size, regardless of whether the capacity physically exists.
Physical Capacity:
The total, used and free amounts of actual SSD storage space available to the cluster. In many configurations, physical capacity is likely to be significantly lower than the provisioned capacity.
HDD
Provisioned Capacity:
The total, used and free amounts of HDD storage space assigned to the cluster, as the host OS sees as its drive size, regardless of whether the capacity physically exists.
Physical Capacity:
The total, used and free amounts of actual HDD storage space available to the cluster. In many configurations, physical capacity is likely to be significantly lower than the provisioned capacity.
VMs
Shows the total of the cluster’s VMs, and a chart grouping totals of VMs by status: active and shutoff.
Clicking on the one of the chart’s VM status groups (active or shutoff) navigates directly to the Compute > Instances screen, displaying the table of VMs filtered according to the selected VM status.
Volumes
Shows the total of the cluster’s volumes, and a chart grouping totals of volumes by their readiness status.
Clicking on the one of the chart’s volume readiness status groups navigates directly to the Storage > Block Storage screen, displaying the table of volumes filtered according to the selected volume status.
Node Availibilty & Health
Shows the total of the cluster’s nodes, and lists the nodes individually.
Clicking on one of the nodes opens a popup displaying:
Link that navigates directly to the node’s details screen: Configuration > Nodes > <node name>.
Status: The node’s health status.
Uptime: Time since the node’s last reboot.
Memory: The node’s total, used and reserved physical RAM.
CPU: The node’s total of logical CPUs, and current percentage usage.
Storage Availibilty & Health
Shows the combined total of SSD and HDD storage volumes. Color-coded entries indicate the health status of each of the SSD and HDD storage class groups.
Clicking on a storage class navigates to the selected Storage Management > Storage Classes > SSD or HDD details screen.
Virtual IPs
A virtual IP (VIP) exists only in software and can move between different physical machines, ensuring connectability to a service using a consistent address irrespective of the underlying infrastructure.
Zadara Operations team provisions clusters with preconfigured VIPs.
VMs Per Node
Each node in the cluster is listed with icons representing each of its VMs, color-coded to indicate the VM’s status.
Hovering over a VM icon displays the VM’s name and status.
Clicking a VM navigates directly to the selected VM’s Compute > Instances > <VM> details screen.
Monitoring Diagnostics
Diagnostics run on system validators at hourly intervals.
For the latest diagnostics run, and each previous run, the Monitoring > Diagnostics screen displays a Diagnostics Results summary row with the following columns:
The number of system validators checked.
A color-coded bar indicating the status.
A Details link that navigates to the selected diagnostic run’s Periodic Validators details screen, which lists the name and status of each system validator.
Timestamp of the diagnostics run.
Completion status of the diagnostics run.
In the event of a user-invoked diagnostics run, the username appears in the User column, otherwise the column entry remains blank for a regular scheduled system diagnostics run.
Invoking a diagnostics run
To invoke an immediate non-scheduled diagnostics run:
Go to Monitoring > Diagnostics.
In the top toolbar click Run.
A Run Diagnostics dialog opens.
Enter the parameters:
Type:
Select one of:
Default: Diagnostics run on all system validators.
Custom: The dialog expands, listing each system validator separately, with a checkbox to mark to include it in the custom diagnostics run.
Decription: Optional description that is displayed in the diagnostic run’s Periodic Validators details screen.
Click Ok to launch the immediate diagnostics run.
Data Collection
Zadara Operations and Support may request data for analysis of performance, issues or other symptoms.
To download the requested data:
Go to Monitoring > Data Collection.
Existing data collection downloads for the cluster appear in a table.
In the top toolbar click + Create.
The Collect Data for Download dialog opens.
Enter the parameters:
Data Type:
Select one of the Data Type options:
Logs (default):
Enter the following parameters:
Log Files: Enter the file pattern as a string that comprises the file names, or matches files that contain the string.
Note
Wildcards are not supported.
The entered file pattern string is displayed in the data collection run’s entry on the Monitoring > Data Collection list.
Decription: Optional description that is displayed in the data collection run’s entry on the Monitoring > Data Collection list.
Nodes:
Select one of:
All: From all nodes in the cluster, collect files with names matching the entered file pattern.
Only Selected: From the dropdown, select the nodes in the cluster from which to collect files with names matching the entered file pattern.
Excluded Selected: From the dropdown, select the nodes to ignore, and from all other nodes in the cluster collect files with names matching the entered file pattern.
Cluster Dump:
Select the Cluster Dump option to download a comprehensive extract of information about a cluster’s state, including configurations, networking, storage, and VM metadata.
Click Collect Data to create the selected data collection set for download.
A new entry appears in the Data Collection table, displaying the filename pattern, progress status of the data collection process, creator username, and timestamp.
After the data collection’s status changes to Done, click its row in the table to display additional operations for that data collection.
To download the selected data collection to the local machine, on the upper tool bar click Download.
The download file is a zipped tar with the namimg convention:
logs-dump-<YYYYMMDDHHmmss>.tar.gz.To delete the selected data collection from the cluster, on the upper tool bar click Delete.
To confirm deletion of the selected data collection, in the Delete Data Collection confirmation window, click Delete.
Tip
Best practice
After downloading, delete the data collections to free up occupied space on the cluster.
System Alerts
A system alert is an automated notification or action triggered when specific thresholds are reached or events occur in the cluster’s infrastructure.
To view a summary of system alerts, go to Monitoring > System Alerts.
The following information is available for each system alert:
Name: A descriptive name for the alert.
Entity: The specific resource name that triggered the alert, such as a cluster.
Entity Type: The category of the resource that triggered the alert.
Status: The current state of the alert. If the issue is resolved, the status is Closed.
Updated At: The date and time when the alert status last changed.
Alarms
An alarm is a configuration that monitors data points relative to a set of rules. On reaching the threshold of a specified condition, an alarm’s status changes, triggering reporting of an alarm event.
SNS topics can be used to notify relevant target audiences according to different alarm events.
Use the Alarms screen to view, monitor and manage alarms for your managed resources.
Viewing Alarms
To view alarms:
Go to Monitoring > Alarms.
A list of alarms appears, displaying the following columns:
Name: The alarm name.
Condition: The metric calculation condition that triggers the alarm. The condition is configurable according to the entity type.
Account: The associated MSP account.
Project: The project that contains the monitored entity.
Entity: The monitored resource, that is a specific instance of the entity type.
Entity Type: The resource type, for example:
Autoscale Group
Cluster
Compute Instance
Node
Project
Volume
State: The current alarm status, for example:
OK indicates the condition is not currently met.
ALARM indicates that a condition threshold is met.
INSUFFICIENT DATA typically indicates a manual status change, using the Set State option.
Created At: The date and time the alarm was created.
Updated At: The most recent alarm reporting update time.
View Alarm Details
Go to Monitoring > Alarms.
A list of alarms appears.
Click an alarm name to view its details.
The selected alarm’s detail screen appears with two tabs:
Overview tab:
In addition to the columns displayed in the Monitoring > Alarms list (above):
Trigger
Period: Sampling window time frame in seconds.
Statistic: Calculation on the measured metric:
Average
Sum
Minimum
Maximum
Details: Additional information.
ID: The alarm’s internal UUID.
Topics
SNS topics are used to communicate alarm status changes to configured audiences:
On alarm active
On alarm off
On insufficient data
Events tab:
Displays a list of Events, filtered to display alarm events triggered when the alarm status changed.
The toolbar provides options to:
Create a new alarm.
Modify the selected alarm.
Set State manually.
Delete the selected alarm.
Creating an Alarm
To create an alarm:
Go to Monitoring > Alarms.
A list of alarms appears.
On the top toolbar, click + Create.
The Create Alarm dialog opens.
Enter the alarm’s details:
Name: The alarm name.
Description: A brief description for the alarm.
Trigger Conditions
The parameters of the conditions that trigger the alarm:
Type: The resource type, for example:
Autoscale Group
Cluster
Compute Instance
Node
Project
Volume
Based on the selected resource type, the next prompt provides a dropdown list of the selected resource type entities.
Select the entity instance to monitor for the alarm.
Metric: Based on the selected resource type, from the dropdown select the metric that will be monitored.
Statistic: From the dropdown, select the calculation method on the selected metric:
Average
Sum
Minimum
Maximum
Threshold:
Select the operator (>=, >, <, <=) for the comparison calculation.
Enter the threshold value for the selected metric.
The alarm is triggered when the metric statistic, compared to the threshold value using the selected operator, evaluates to true.
Sampling Window: Enter the duration of the statistic sampling window in seconds.
Click Next to go to the Notifications tab.
In the Notifications tab, from the dropdown select the SNS Topics or click + for Creating an SNS Topic.
This configuration determines the notification distribution for each change in the alarm’s Status.
Repeat the dropdown selection step to add multiple SNS topics to any of the alarm’s status change notification distributions:
On alarm active:
To send out a notification to the relevant distribution list when the alarm is triggered, and its State transitions to ALARM.
This indicates indicates that the alarm’s condition threshold is met.
On alarm off:
To send out a notification to the relevant distribution list when the alarm is deactivated, and its State transitions to OK.
This indicates indicates that the alarm’s condition threshold is no longer met.
On insufficient data:
To send out a notification to the relevant distribution list when the alarm is triggered, and its State transitions to INSUFFICIENT DATA.
This typically indicates a manual status change for the alarm, where the Set State option is used.
To confirm completion of the alarm’s configuration and to save it, click Finish.
The Create Alarm dialog closes, and the alarm row appears in the Monitoring > Alarms list.
Modifying an Alarm
To change the configuration of an existing alarm:
Go to Monitoring > Alarms.
A list of alarms appears.
Click the row or the alarm name to select it.
In the top toolbar, click Modify.
The Modify Alarm dialog opens.
Optionally, update any of the alarm’s details:
Name: The alarm name.
Description: A brief description for the alarm.
Trigger Conditions
The parameters of the conditions that trigger the alarm:
Type: The resource type, for example:
Autoscale Group
Cluster
Compute Instance
Node
Project
Volume
Based on the selected resource type, the next prompt provides a dropdown list of the selected resource type entities.
Select the entity instance to monitor for the alarm.
Metric: Based on the selected resource type, from the dropdown select the metric that will be monitored.
Statistic: From the dropdown, select the calculation method on the selected metric:
Average
Sum
Minimum
Maximum
Threshold:
Select the operator (>=, >, <, <=) for the comparison calculation.
Enter the threshold value for the selected metric.
The alarm is triggered when the metric statistic, compared to the threshold value using the selected operator, evaluates to true.
Sampling Window: Enter the duration of the statistic sampling window in seconds.
Click Next to go to the Notifications tab.
In the Notifications tab, from the dropdown select the SNS Topics or click + for Creating an SNS Topic.
This configuration determines the notification distribution for each change in the alarm’s Status.
Repeat the dropdown selection step to add multiple SNS topics to any of the alarm’s status change notification distributions:
On alarm active:
To send out a notification to the relevant distribution list when the alarm is triggered, and its State transitions to ALARM.
This indicates indicates that the alarm’s condition threshold is met.
On alarm off:
To send out a notification to the relevant distribution list when the alarm is deactivated, and its State transitions to OK.
This indicates indicates that the alarm’s condition threshold is no longer met.
On insufficient data:
To send out a notification to the relevant distribution list when the alarm is triggered, and its State transitions to INSUFFICIENT DATA.
This typically indicates a manual status change for the alarm, where the Set State option is used.
To confirm completion of the alarm’s configuration and to save it, click Finish.
Set Alarm State
It is possible to manually change the alarm’s state.
Reasons could include:
An alarm threshold condition was reached but the threshold measurement is back to normal levels some time before the automatic “OK” notification is distributed. In such a case there might be a decision to manually reset the state and trigger a notification that can lower the support team’s alert level.
Although an alarm condition is not met, other symptoms might be a cause for concern. Manually changing the alarm state will trigger a notification that will raise the support team awareness level.
Immediately after an alarm notification is triggered due to meeting a threshold condition, the team would likely analyze the status. Analysis might determine that although the threshold has been reached and might not return to OK for a while, the scenario is under control, and manually changing the status will trigger another notification that can reduce the urgency level.
To manually set an alarm’s state:
Go to Monitoring > Alarms.
A list of alarms appears.
Click the row or the alarm name to select it.
In the top toolbar, click Set State.
The Set Alarm State dialog opens.
In the Set Alarm State dialog:
State:
From the dropdown, select the state:
OK to indicate the threshold condition is not currently met.
ALARM to indicate that the threshold condition threshold is met.
INSUFFICIENT DATA to indicate something other than OK or ALARM.
Reason:
Enter an explanation for manually setting the alarm’s state.
To confirm the alarm state change, click OK.
Deleting an Alarm
Deleting an alarm deactivates it and removes its configuration.
However, its events are still available for viewing in the Events Log for the duration of event retention. For further information, see Monitoring zCompute Events.
To delete an alarm:
Go to Monitoring > Alarms.
A list of alarms appears.
Click the row or the alarm name to select it.
In the top toolbar, click Delete.
The Delete Alarm dialog opens, displaying the alarm name and ID.
To confirm deletion of the selected alarm, in the Delete Alarm dialog click Delete.
The Delete Alarm dialog closes, and the alarm row disappears from the Monitoring > Alarms list.
SNS Topics
SNS topics are used to communicate notifications to relevant audiences.
Viewing SNS Topics
To view SNS topics:
Go to Monitoring > SNS Topics.
A list of SNS topics appears, displaying the following columns:
Name: The SNS topic’s name.
Subscriptions: The number of email addresses subscribing to this SNS topic.
User The admin username who created the SNS topic.
Account: The account in which the SNS topic was created.
View SNS Topic Details
Go to Monitoring > SNS Topics.
A list of SNS topics appears.
Click an SNS topic name to view its details.
The selected SNS topic’s detail screen appears:
Overview section
Name: The SNS topic’s name.
User: The admin username who created the SNS topic.
Project: The project for which the SNS topic was created.
Account: The account in which the SNS topic was created.
Subscriptions size: The number of email addresses subscribing to this SNS topic.
ID: The SNS topic’s internal ID.
Subscribers section
Lists the email addresses of subscribers to this SNS topic.
Creating an SNS Topic
To create an SNS topic:
Go to Monitoring > SNS Topics.
A list of SNS topics appears.
On the top toolbar, click + Create.
The Create Topic dialog opens.
Enter the topic’s details:
Name: The topic’s name.
Subscribers: The email addresses that will receive this topic’s notification messages.
To add a second or more email addresses, after entering the first email address press enter. The email address appears on a greyed background with an
xcontrol to delete it. Add a new email address next to it and press enter.
To save the topic, click OK.
Modifying an SNS Topic
There are two separate aspects for modifying an SNS topic:
Modifying an SNS Topic Name
Go to Monitoring > SNS Topic.
A list of SNS topics appears.
Click the row or the SNS topic name to select it.
In the top toolbar, click Modify.
The Modify Alarm dialog opens.
Enter the new name for the topic.
To save the SNS topic name change, click OK.
Adding or removing SNS Topic Subscribers
A subscriber is an email address that is subscribed to an SNS topic to receive the topic’s email notification messages.
Go to Monitoring > SNS Topic.
A list of SNS topics appears.
Click the SNS topic name to select it.
The SNS topic’s detail screen opens.
The Subscribers list of email addresses appears in the lower half of the screen.
Adding a new subscriber:
On the Subscribers toolbar, click + Create.
The Subscriptions dialog opens.
Enter the subscriber’s email address.
To add a second or more email addresses, after entering the first email address press enter. The email address appears on a greyed background with an
xcontrol to delete it. Add a new email address next to it and press enter.To save the new subscriber email addresses, click OK.
The new email addresses appear in the SNS topic’s Subscribers list.
The Subscriptions size in the Overview section displays the updated total of subscriber email addresses.
Removing an existing subscriber (unsubscribing):
To select one or more subscriber email addresses to remove, mark their email address check box.
To remove all subscriber email address for an SNS topic, click the top Address checkbox, and all checkboxes will be marked.
To deselect marked email addresses, click the relevant marked checkbox, or the the top Address checkbox to select/deselect all email addresses.
If there are any marked subscriber email addresses, the Delete options appears in the Subscribers toolbar.
On the Subscribers toolbar, click Delete.
The Delete Subscription dialog opens, listing the subscriber email addresses that are marked for deletion.
Caution
The Delete action will remove ALL of the marked subscriber email addresses, and does not prompt for each one separately.
To confirm deletion of the subscriber email addresses listed in the Delete Subscription dialog, click Delete.
The marked email addresses no longer appear in the SNS topic’s Subscribers list.
The Subscriptions size in the Overview section displays the updated total of subscriber email addresses.
Deleting an SNS Topic
Deleting an SNS topic removes the topic and its subscribers.
To delete an SNS topic:
Go to Monitoring > SNS Topic.
A list of SNS topics appears.
Click the row or the SNS topic name to select it.
In the top toolbar, click Delete.
The Delete Topic dialog opens, displaying the topic name and ID.
Caution
If the topic is connected to any alarms, those alarms are listed in the the Delete Topic dialog.
Before proceeding with the SNS topic deletion, it is recommended to check the alarm and verify that the deletion of the topic should proceed.
Connected alarms’ Notification tabs should be updated. See Modifying an Alarm.
To confirm deletion of the selected topic, in the Delete Topic dialog click Delete.
The Delete Topic dialog closes, and the alarm row disappears from the Monitoring > SNS Topics list.
System
The Monitoring > System screen to enables monitoring the real-time health and status of platform services. It provides a visual summary of service state and a detailed service events breakdown view.
Monitoring System screen layout
The Monitoring > System screen includes:
A left control pane for filtering and display options
A service overview panel (top)
A Service events panel (bottom)
Monitoring System screen default view
By default:
Services are grouped by Group.
Tiles are colored by Status.
Active services appear in green.
The overview displays service categories, such as:
General
API Services
Region Management
Compute Services
Region Monitoring
Cloud Network
Cloud Compute
Policy Engine
The number shown next to each category indicates the total number of services in that category.
Each small square tile represents a single service instance.
If all services are operating normally, tiles appear in the color associated with the Active or Normal state.
Monitoring System screen left control pane
The left pane includes controls to change how services are displayed:
Filter
Enter text to restrict the display to matching services.
Group by
Use Group by to organize services by none, one or more attributes:
Group (default)
Name
Status
Importance
Node
When selecting multiple attributes, the system nests groupings in the order selected. For example:
Selecting Group, Status, Importance, Node creates a hierarchical layout:
Service category
Status (for example, Active)
Importance (for example, Normal)
Node (<node name>)
Selecting Node displays services grouped by host, which helps identify node-level issues.
Selecting Importance highlights service priority within each group.
Removing all group selections displays all services in a flat layout.
Color by
From the dropdown, select one of the Color by options to control how service tiles are colored:
Status (default)
Tiles reflect the operational state of each service.
Importance
Tiles reflect the configured priority level.
CPU
Tiles reflect current CPU utilization.
The legend displays utilization ranges.
Hover over a tile to view the exact percentage.
Memory
Tiles reflect current memory utilization.
A legend displays memory usage ranges.
Coloring by CPU or Memory helps you quickly identify resource pressure across services.
Reset All
Select Reset All to clear filters and restore the default view.
Service overview panel (top)
The top service overview main panel displays services according to the layout configured in the left control pane.
Hover over a service tile to display:
Service name
Current metric value (for example, CPU percentage)
This allows quick inspection without changing screens.
Service events panel
The lower Service events panel displays events for the selected time range.
Use the date and time selectors to define the reporting period.
Use the Filter box to search for events.
Select More filters to apply additional criteria.
If no events exist for the selected time range, the screen displays There are no events.
Best practices
Use this screen as part of regular operational monitoring.
Use Color by CPU or Memory to detect resource saturation.
Group by Node to isolate host-level problems.
Group by Importance to focus on critical services.
Review events after upgrades or configuration changes.