Service Controller
The Service Controller page is the dashboard for the storage service controller in Storage Management.
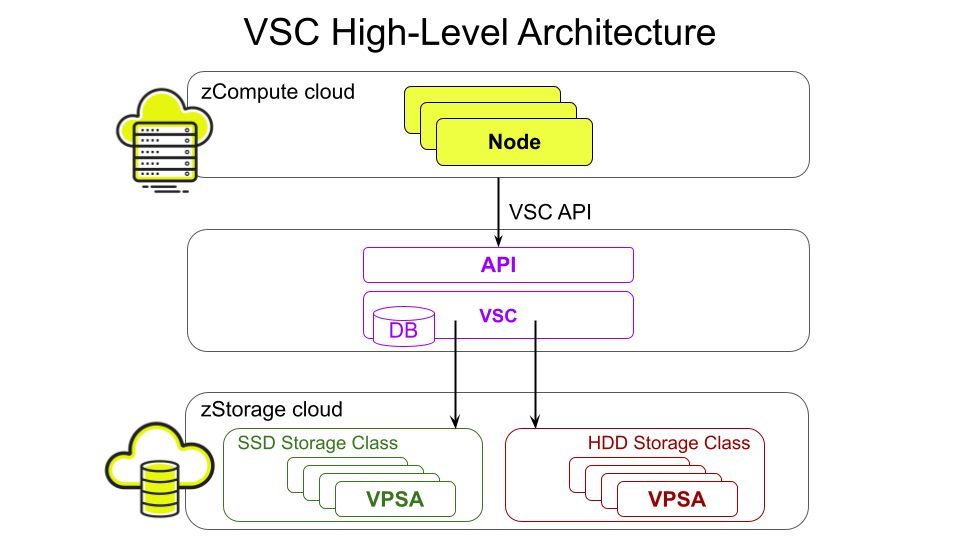
The Volume Service Controller (VSC) is zCompute’s storage control plane. It provides a volume-as-a-service interface to users while abstracting away the complexity of managing the underlying VPSAs. VSC is a control-plane component only. It runs as an independent microservice that sits between zCompute and the zStorage cloud. The VSC is the component responsible for managing and orchestrating storage subsystem components and objects such as VPSAs, Storage Classes, block storage volumes, volume cloning, snapshots, volume migrations, backup to Object Storage, and more.
Key Concepts:
Storage Class
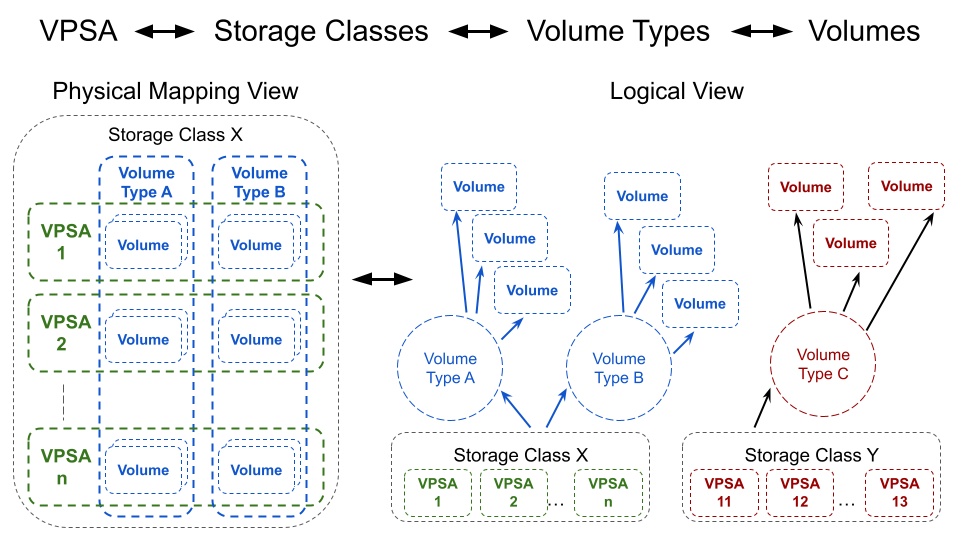
An aggregation of one or more uniform VPSAs (same engine type, media type, similar drive counts). The Storage Class defines high-level capabilities, such as performance tier, compression, dedupe, encryption.
Volume Type
The Volume Type is derived from a Storage Class with specific QoS limits, such as maximum read/write IOPS and maximum read/write MB/s.
Volume
A Volume is provisioned by the end user defined by a selected Volume Type. The user specifies capacity, and the VSC handles placement across member VPSAs.
VSC Hierarchy
VSC high-level architecture:
VSC abstraction: VPSA ↔ Storage Class ↔ Volume Type ↔ Volume:
Key Benefits
Simplified provisioning: by specifying capacity and QoS, the VSC handles VPSA selection and lifecycle.
Near infinitely scalable EBS via horizontal expansion - adding VPSAs to a Storage Class.
Automatic monitoring of VPSA capacity, performance, and health, with volume redistribution to maintain QoS.
AWS-style volume types and AWS API/CLI storage-pool to volume-type compatibility.
The Service Controller page brings command center details, storage summary values, and VSC events into one central dashboard.
Use this page to review the controller details that the platform reports, check the current storage counts, and inspect recent storage controller events.
The page also provides filtering, paging, and related-event access for the event list.
Viewing the service controller dashboard
To view the service controller dashboard:
Select Storage Management > Service Controller.
The service controller dashboard opens, displaying the Command Center Info and Summary panes in the upper part of the screen.
The lower section of the screen lists summary entries of recent VSC Events.
Viewing Command Center Info and Summary
The Command Center Info and Summary panes appear in the upper part of the service controller dashboard.
Command Center Info details pane:
IP
The command center IP address.
Cloud Name
The command center name.
ID
The command center’s unique ID.
Summary pane displays the totals of current storage objects and protection activity:
Storage Classes
The number of storage classes in the cloud.
VPSAs
The number of Virtual Private Storage Arrays (VPSAs) associated with the cloud.
Volumes
The number of volumes in the cloud.
Snapshots
The number of snapshots in the cloud, relecting the total sum of Local snapshots and Obs snapshots.
Protection Groups
The number of protection groups.
Backup jobs
The number of backup jobs.
Restore jobs
The number of restore jobs.
Local snapshot
The number of local snapshots.
Obs snapshot
The number of Remote Object Storage Snapshots snapshots.
Viewing VSC events
The VSC Events pane filters events to display VSC events only.
The VSC Events list has the following columns:
Severity
The event severity value:
Critical
Error
Warning
Info
Time
Date and time that the event occured.
Entity Name
The entity name linked to the event.
Name
The event name.
Details
The event message text.
Account
The related account, when the event is account-specific.
Project
The related project, when the event is project-specific.
User
The username of the user that triggered the event.
Related Events
Provides access to events related to the event row.
Selecting View redirects to the Monitoring > Events screen, filtered to events of the row’s [Event Name]. See also Monitoring zCompute Events.
Recommended best practices
Review Command Center Info first to confirm that the page is showing the expected command center record.
Review Summary next. The counts provide a quick status view before deeper investigation.
Set the date range before reading VSC Events. This keeps the event list focused.
Use Filter… and More filters to reduce large result sets.
Review Severity, Name, and Details together when you inspect an event row.
Open View in Related Events when one row does not provide enough context.
Troubleshooting
The page opens, but key values are missing
If the panes load without expected values, confirm the visible page areas first.
Confirm that Command Center Info is shown.
Confirm that Summary is shown.
Reload the page and check the panes again.
The event list is too large to review
Use the visible list controls to reduce the scope.
Narrow the date range.
Enter text in Filter….
Open More filters and apply additional limits.
Move to the correct page with the paging controls.
You cannot find the event that you need
The event might be outside the current list view.
Expand the date range.
Clear the value in Filter….
Review more pages by using 1, 2, 3, or the page arrows.
A single event row is not enough
Some events are easier to review with their linked records.
Find the event row.
Select View in Related Events.
Review the linked event records.