Access Logs
Command Center maintains centralized cloud-level Access Logs. In addition to basic information such as the accessing user and the date and time, the system also logs access details including the accessed components, actions, access type (web or API), and originating IP address.
Access Logs can be viewed and searched from the Command Center’s cog wheel menu at the top right of the screen.
Note
Unlike Command Center’s Central Log, Access Logs cannot be exported to an external syslog daemon.
Managing Command Center Access Logs
Cloud logs can be searched and specific events extracted, using the Command Center filtering functionality.
To view and search for specific content in Access Logs:
At the top right of the screen, click the cog wheel.
From the dropdown menu, select Access Logs.
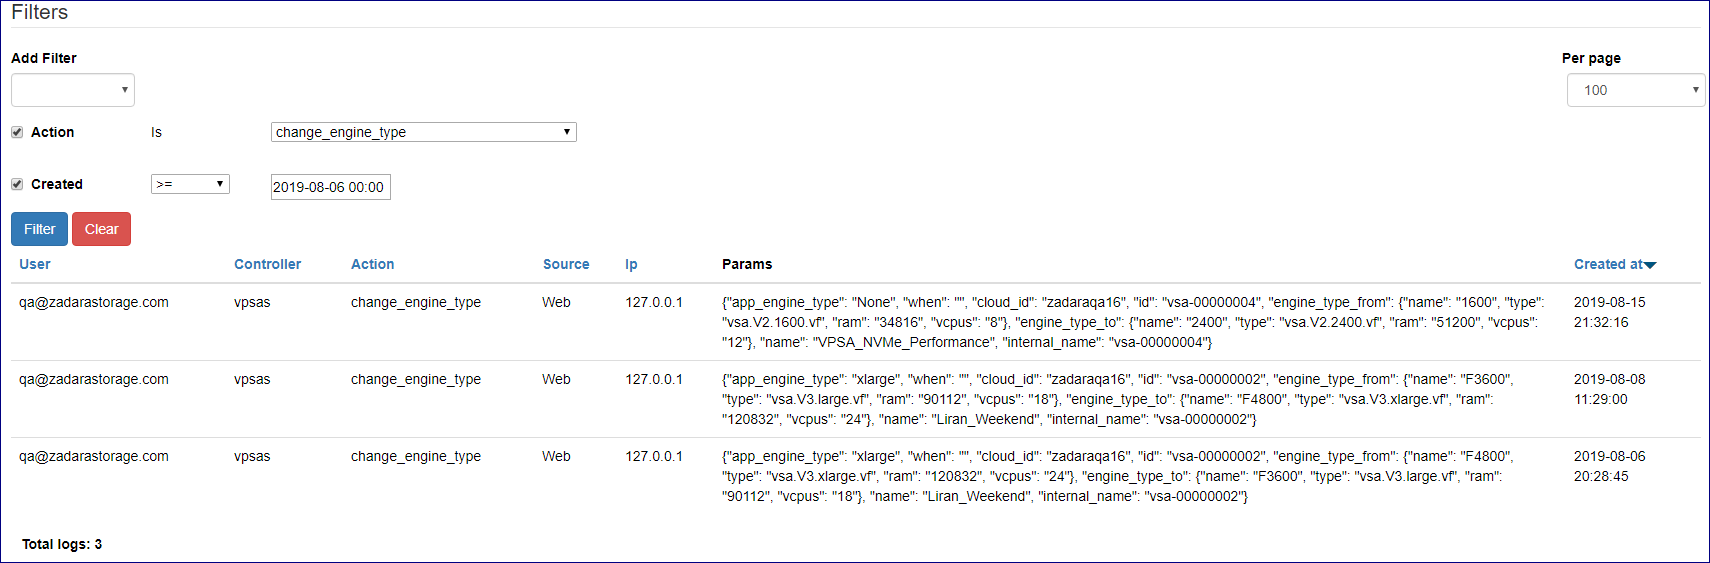
In the Access Logs view, click in Add Filter to display its dropdown, and select and configure one or more filters to narrow down the Access Logs events search:
Controller: The accessed component.
To narrow down the search to a specific controller, from the dropdown, select one of:
sessions
clouds
vlans
nodes
vpsas
zioses
drive_types
images
custom_networks
drives
vfloating_ips
admins
license_keys
Action: The action peformed or attempted by Command Center on the controller.
Note
Each controller has a set of possible actions, and each action is associated with only one controller.
If a controller is specified for the search, from the dropdown, optionally select one of the actions of that controller to narrow the search.
If a controller is not specified for the search, selecting an action from the dropdown effectively narrows the search to logged events of the action and its implied controller.
Access Type: The access method.
To narrow down the search to a Access Type, from the dropdown, select one of:
Web: Access requests originating from a web browser.
API: Access requests originating from an application API.
IP Address: The IP address from which the access request originated.
To narrow down the search to a specific IP address, enter the IP address in the text box.
Note
Only a single IP address can be entered as a filter. Wildcards and CIDRs are not valid entries.
User: The username of the user who triggered the access request.
To narrow down the search to a specific user, from the dropdown, select the user.
Created:
From the dropdown select the log entry’s creation date’s relational operator:
>=: On or after date and time (inclusive). Select the date and edit the time. The search will return matching log entries created on or after the entered date and time.
<: Before date and time (exclusive). Select the date and edit the time. The search will return matching log entries created before the entered date and time.
Between: A period specified by a starting date and time, and an ending date and time. Select the start and end dates, and edit the time for each. The search will return matching log entries created on or after the starting date and time, and before the ending date and time.
Click Filter.
The Params column displays a JSON string specifying the performed or attempted event’s parameters and their values.